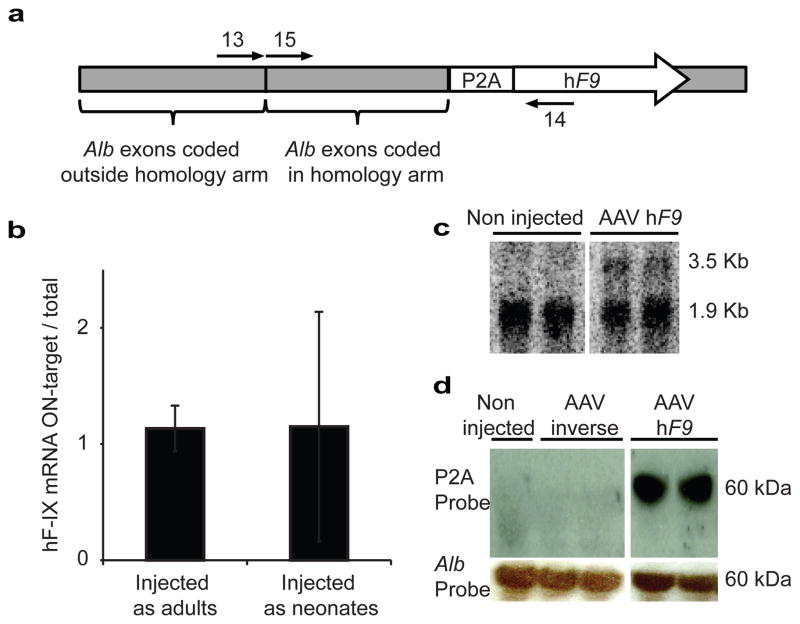
Figure 4. Specificity of hF9 expression.
a. cDNA, produced from RT with a poly-dT primer, served as a template for either a qPCR assay with primers 13–14 or 14–15. b. Bars represent the rate of Alb_hF9 mRNAs to total hF9-containing mRNAs as the ratio between the abundance of the cDNA template amplified by primers 13–14 to the abundance of the cDNA template amplified by primers 14–15. N = 3 for each group, error bars represent standard deviation. c. Northern blot analysis of liver samples with a probe against P2A. The lower non-specific signal corresponds in size to 18S rRNA. d. Western blot analysis of P2A from liver samples of mice injected with the AAV-P2A-hF9 construct or inverse control. P2A is expected to be fused to Albumin (66.5-Kd).

