
Figure 6.
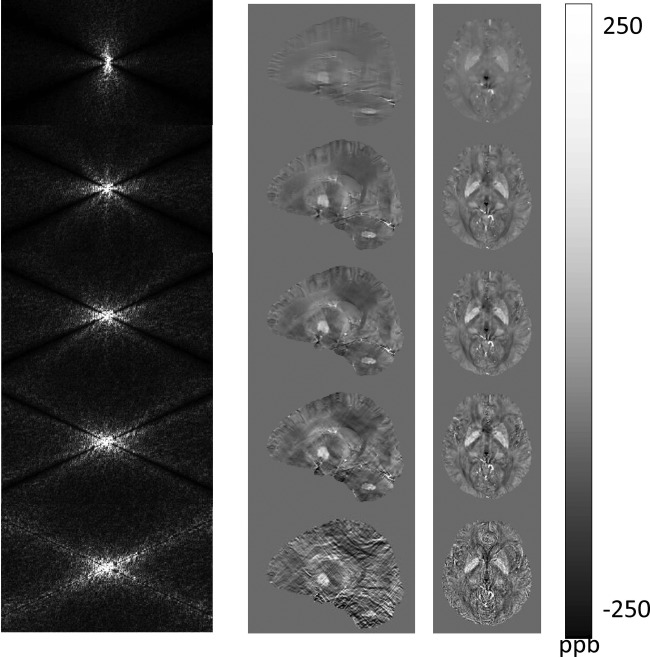
Evolution of susceptibility solutions in conjugate gradient. Susceptibility images in k-space (left column) and r-space after the first, third, fifth, 10th, and 100th iterations using the conjugate gradient solver demonstrate that the none-cone region in k-space converges quickly in the first few iterations; and the later iterations mainly contribute to signal in the cone region that manifests as streaking artifacts in the sagittal view and noise in the axial view in r-space.