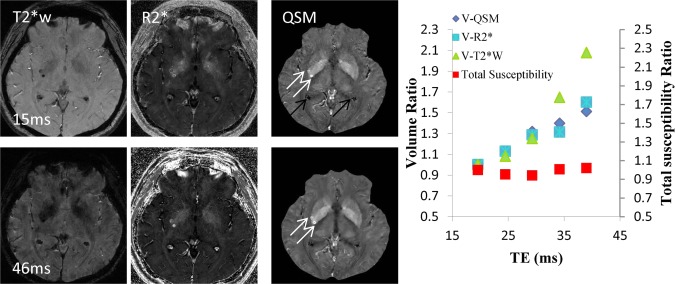
Figure 9.
Quantitative susceptibility mapping for measuring paramagnetic heme iron. The total susceptibility of a cerebral microbleed measured on QSM is a physical property that is independent of TE, providing a universal measure for cerebral microbleeds burden (10 patients with 40 microbleeds). Left image panel: Microbleed appearance changes with TE (15 msec top row; 46 msec bottom row) drastically in magnitude and moderately in the R2* map but little in QSM (white arrows). Ventricle calcifications have the same sign on T2*w and R2* but opposite sign on QSM (black arrows) as microbleeds. Right graph: When TE was increased from approximately 20 to 40 msec, the measured cerebral microbleed volume increased by mean factors of 1.49 ± 0.86 (standard deviation), 1.64 ± 0.84, and 2.30 ± 1.20, respectively, for QSM, R2*, and T2*w, respectively (P < .01). However, the measured total susceptibility with QSM did not show significant change over TE (P – .31), and the variation was significantly smaller than any of the volume increases (P < .01 for each). QSM, quantitative susceptibility mapping; TE, echo time. Source: Liu et al, Radiology 2012;262:269–278.

