
Figure 13.
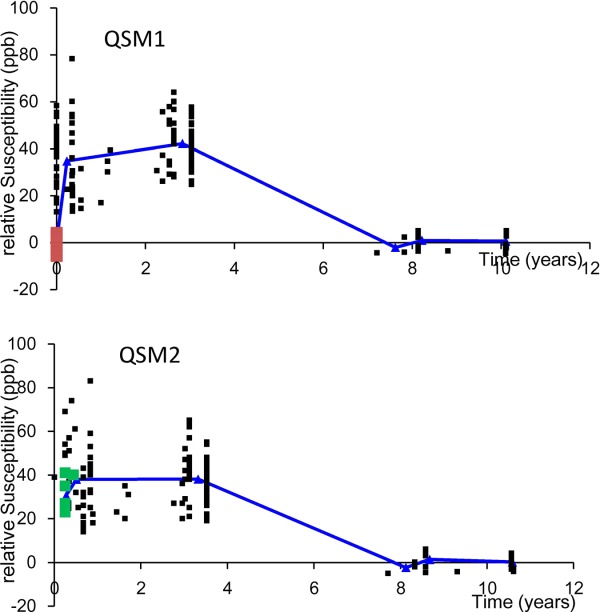
Time course of susceptibilities of multiple sclerosis lesions. The susceptibility time course may provide new insight into pathophysiologic features of MS lesions (23 patients with 162 lesions): Magnetic susceptibility of MS lesion increases rapidly as it changes from enhanced to nonenhanced, attains a high-susceptibility value relative to NAWM during its initial few years (approximately 4 years), and gradually dissipates back to susceptibility similar to that of NAWM as it ages. The graphs depict lesion susceptibility values (relative to NAWM) at various ages in QSM1 performed at a first time point (top) and in QSM2 at a second time point (bottom). Red points in QSM1 denote acute enhancing lesions at lesion age – 0 year; follow-up presented as green points in QSM2 demonstrated a substantial increase in susceptibility. Blue lines represent average susceptibilities of nonenhanced lesions in the age groups of 0 to 2, 2 to 4, 6 to 8, and 8 to 10 years and enhancing lesions. QSM, quantitative susceptibility mapping; MS, relapsing-remitting multiple sclerosis; NAWM, normal appearing white matter. Source: Chen et al, Radiology 2014;271:183–192.