
Figure 14.
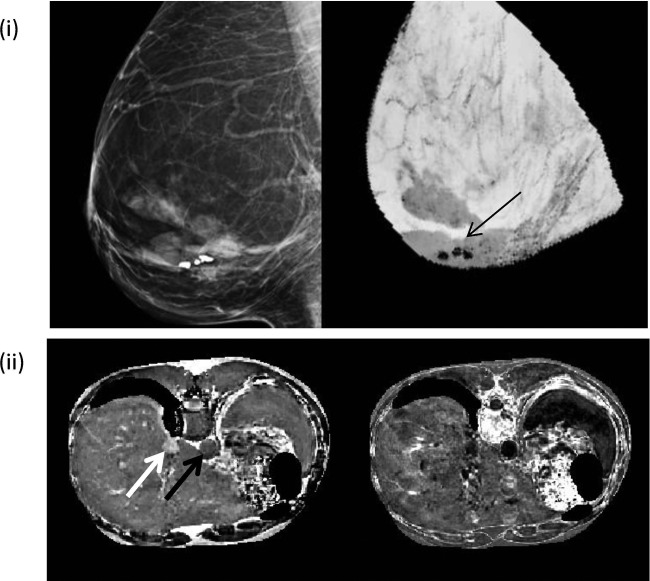
Quantitative susceptibility mapping applications in the breast and liver. (i) Left image is a mammogram and right image is the corresponding QSM (minimal intensity project through the 3D volume) of a breast in a female patient with three calcified nodules (arrow on QSM). Fatty tissues in the breast appear less diamagnetic compared to the gland. (ii) QSM and R2* images of a liver are shown in the left and right, respectively. Hepatic vein and subcutaneous fat (white arrows in left) appear paramagnetic. The susceptibility difference between the hepatic vein (white arrow) and the aortic artery (black arrow) are 0.53 ppm. 3D, three dimensional; QSM, quantitative susceptibility mapping.