
Fig.6.
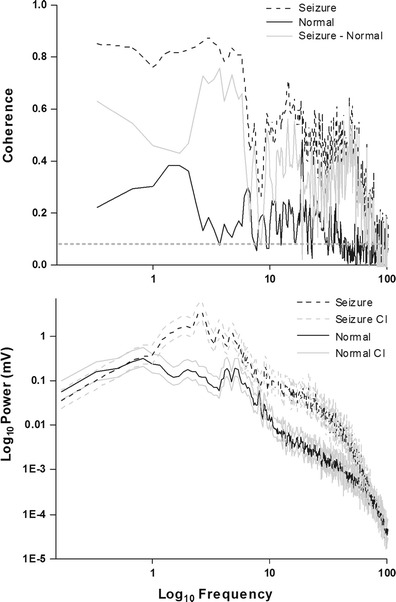
Seizures displayed higher power and increased coherence than normal EEG. This is an example of the coherence (top panel) and power spectrum (bottom panel) for the epileptiform event in Fig. 4d (dashed line) compared to normal EEG activity 3 days after collagenase-induced ICH (solid line). Any increase in coherence above the confidence interval limit (dotted line) of the difference between seizure and normal activity (gray solid line) was significant. The gray lines in the power spectrum represent the 95 % confidence interval (CI) and the black lines the mean values for the spectrum. For those increased frequencies, there were also increases in coherence