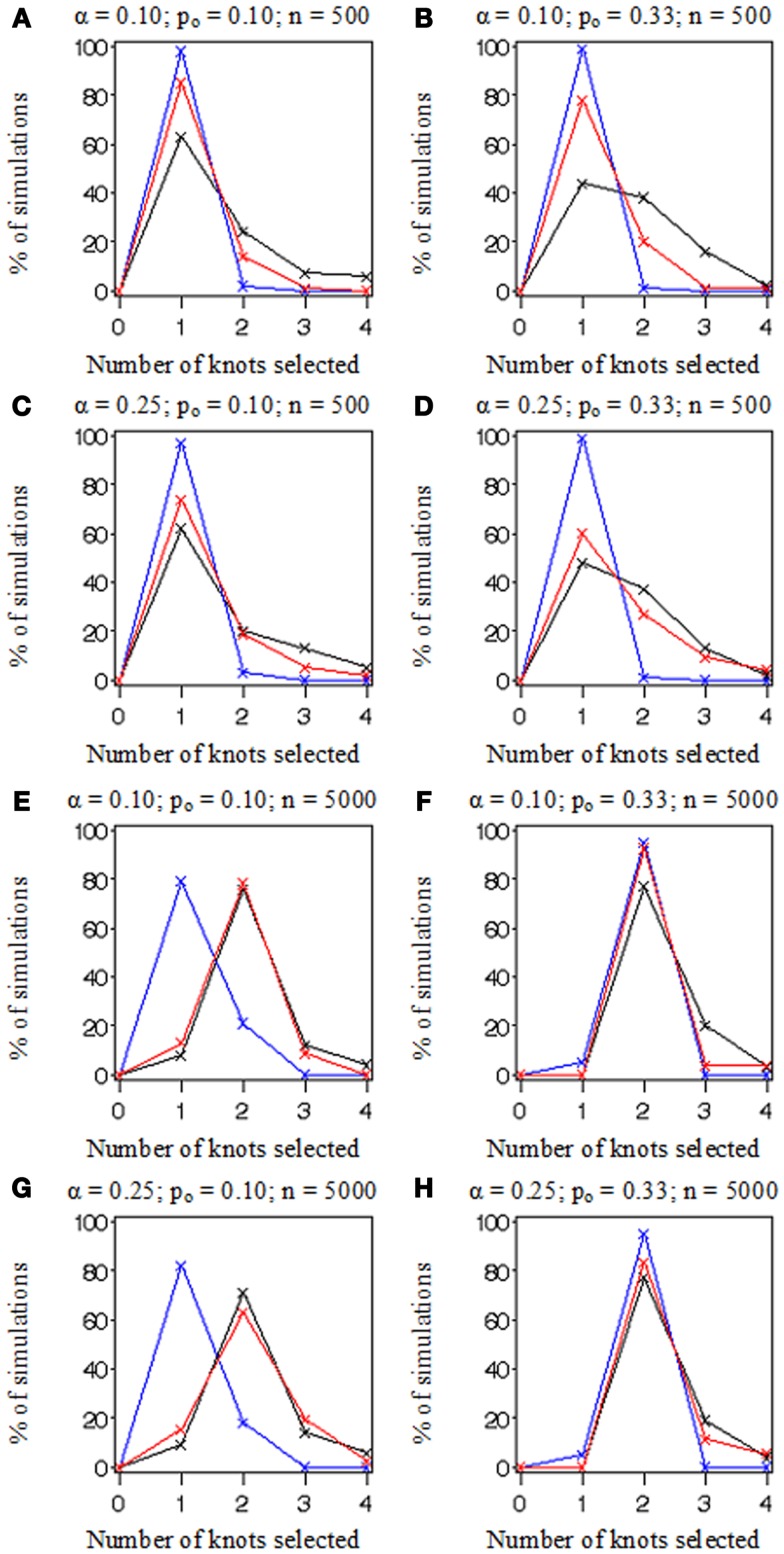
Figure 3.
A comparison of knot selection simulation results. Plotted lines connect frequencies for the number of knots fitted to 100 simulated datasets by method: AIC (in black), BIC (in blue), and the parametric bootstrap MLE 2 df selection procedure (in red). Each (A–H) depicts results from data simulated under various conditions including the proportion of events, po (0.10 or 0.33) and sample size, n (500 or 5,000), and evaluated by our methods with two selection criterion settings, α (0.10 or 0.25).

