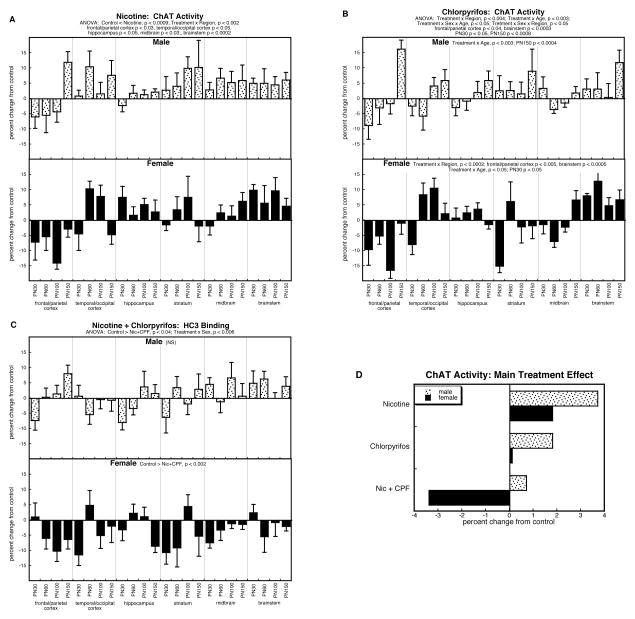
Figure 4.
Effects of nicotine (A), chlorpyrifos (B), and combined treatment (C) on ChAT activity. Data represent means and standard errors, presented as the percent change from control values; complete original data are shown in Supplement Table 5. Multivariate ANOVA for each treatment appears at the top of the panels. Lower-order tests for each sex were carried out only where there was a treatment × sex interaction (B,C). Effects on specific regions and ages are stated above or within the panels where appropriate. Panel (D) shows the simple main treatment effects, collapsed across all the other variables.

