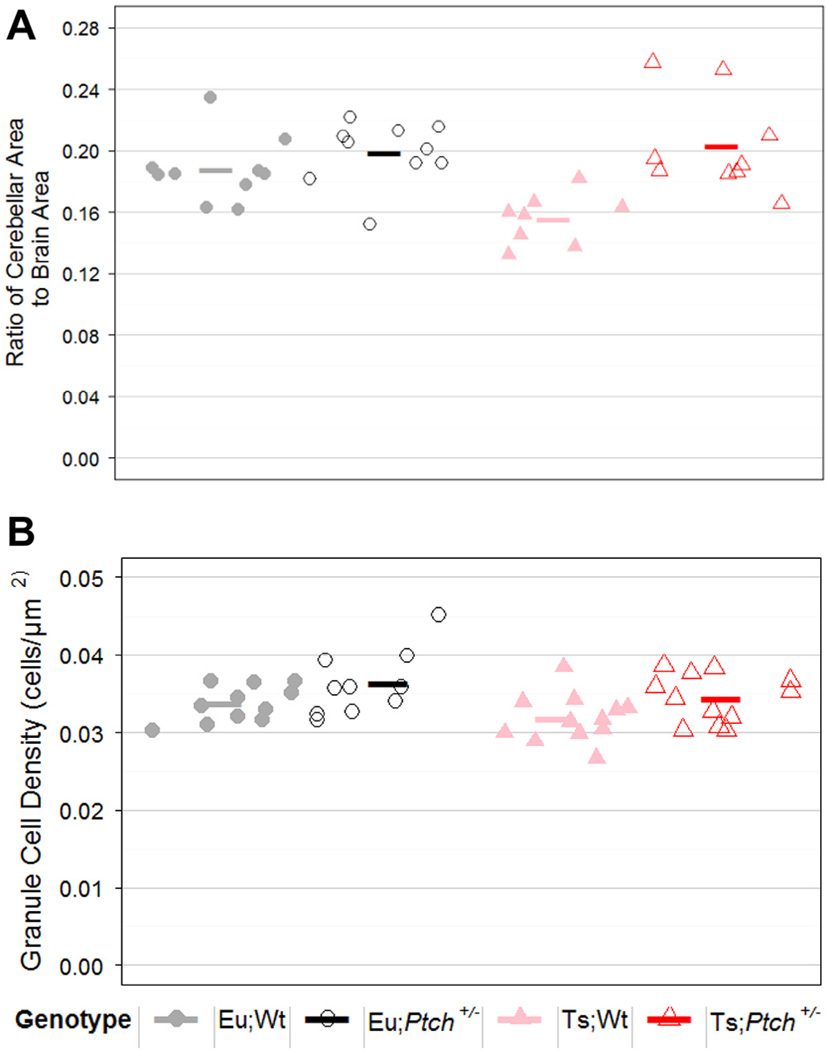
Fig. 7.
Haploinsufficiency of Ptch1 normalized cerebellar morphology in Ts65Dn mice. Cerebella in Ts;Ptch+/− mice were larger and higher in GC density than Ts;Wt mice but did not differ from Eu;Wt mice. Graphical representation of (A) the average midline cerebellar area as a fraction of the total brain area for each mouse as well as the overall average ratio for each ploidy; (B) the average cerebellar GC density in cells per µm2 for each mouse as well as the overall average for each ploidy. For cerebellar area: Eu;Wt n = 10, Eu;Ptch+/− n = 10, Ts;Wt n = 8, Ts;Ptch+/− n = 9. For GC density: Eu;Wt n = 11, Eu;Ptch+/− n = 10, Ts;Wt n = 12, Ts;Ptch+/− n = 12.

