
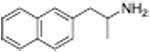
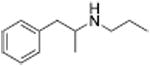
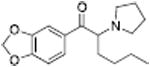
Table 3. Dopamine (DA) uptake inhibition and releasing effects for a series of phenethylamines that display the transition from full efficacy, to partial efficacy, to uptake inhibition as determined in rat brain synaptosomes.
| DAT UI | DA Release | |||
|---|---|---|---|---|
| Name | Structure | IC50 (nM) | EC50 (nM) | EMAX |
| PAL-287 |
|
12.6 ± 1 | 102 ± 1 | |
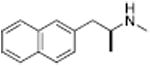
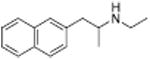
| PAL-1046 |
|
10 ± 1 | 101 ± 3 | |
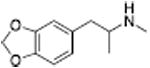
| MDMA |
|
108 ± 10 | 103 ± 2 | |
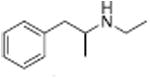
| PAL-99 |
|
115 ± 35 | 111 ± 13 | |
| PAL-169 |
|
296 ± 20 | 90 ± 1 | |
|
| ||||
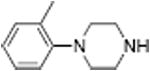
| PAL-1045 |
|
46 ± 11 | 78 ± 5 | |
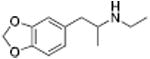
| MDEA (PAL-193) |
|
622 ± 121 | 61 ± 2 | |
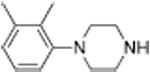
| PAL-218 |
|
1207 ± 118 | 66 ± 1 | |
|
| ||||
| PAL-424 |
|
1013 ± 101 | ||
| MDPV |
|
4.1 ± 0.06 | ||
| PAL-233 |
|
9523 ± 436 | ||
Release EC50 and Uptake Inhibition IC50 values are reported as means ± SD and are the result of n= 3 performed in triplicate. Otherwise details are as for Table 1.