Figure 1.
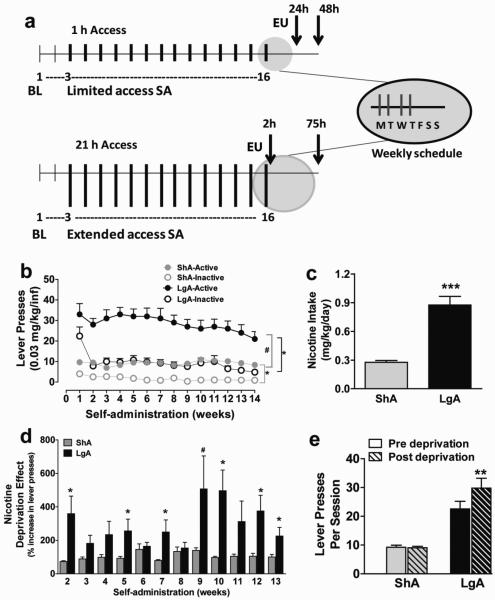
(a) Schematic of the experimental design. Each vertical line (tick) represents one week of self-administration session (thin line, baseline (BL); thick line, limited or extended access. Top panel represents the experimental design for limited access (ShA) animals. All animals received baseline sessions for two weeks followed by limited (1 hour) or extended (21 hours) access sessions for 14 weeks (indicated in the main panel). Each week was composed of 4 consecutive daily sessions of self-administration followed by 3 days of abstinence (indicated as weekly schedule). Top panel represents the experimental design for limited access (ShA) animals. ShA animals were euthanized (EU) at two different time points, 24 (n = 4) and 48 (n = 4) hours, after their last self-administration session. All ShA animals were combined for immunohistochemical analysis. Bottom panel represents the experimental design for extended access (LgA) animals. LgA animals were euthanized at two different time points, 2 (n = 4) and 75 (n = 5) hours after their last self-administration session and the two LgA groups were not combined for immunohistochemical analysis. (b) Weekly 4 day average of nicotine intake (mean ± SEM) in rats that self-administered nicotine under a fixed-ratio (FR)1 schedule in either 21 h extended access (LgA) or 1 h limited access (ShA) sessions. LgA rats had higher number of active lever presses when compared with ShA rats. Total number of nicotine infusions per session per week (active operant responses) was significantly higher than the total number of inactive operant responses per session in LgA and ShA animals. * p < 0.05 compared with inactive responses; # p < 0.05 compared with ShA active responses. (c) Total nicotine consumed over the period of 14 weeks (data is the average of 4 sessions per week for 14 weeks); *** p < 0.0001 compared with ShA. (d) Percent increase in the number of lever presses during the first hour of the post-deprivation of LgA/ShA session (day 1 after 3 days of deprivation) compared with the previous pre-deprivation session (day 4 during the previous week of self-administration). LgA animals are in black and ShA animals are in gray. *p < 0.05; #p = 0.06 compared with ShA animals. (e) Average number of lever presses pre- (day 4) and post-deprivation (day 1) over the entire 14 week period. **p<0.01 compared with pre-deprivation sessions. n = 8–9 per group.

