Figure 2.
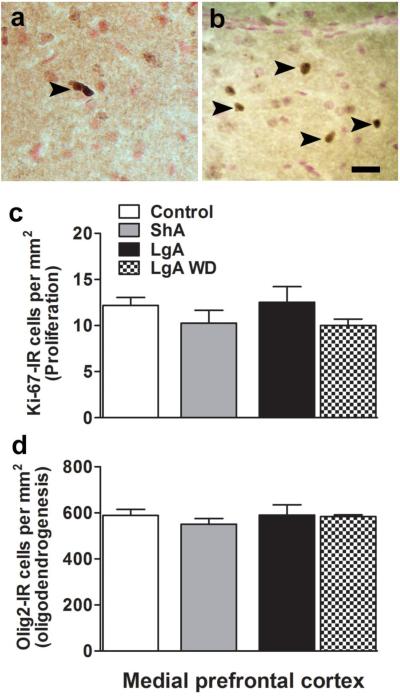
Schematic representation of Ki-67 (a) and Olig2 immunoreactive cells (b) in the mPFC. Arrowhead points to positively stained cells. Scale bar in (b) is 30um. Quantitative analysis of Ki-67 (c) and Olig2 (d) labeled cells per mm2 of the mPFC by stereology. ShA animals from both 24h and 48h groups were combined; n = 8. LgA animals from 2h and 75h groups are represented separately; n = 4-5 each group. n = 12 in drug naïve controls.

