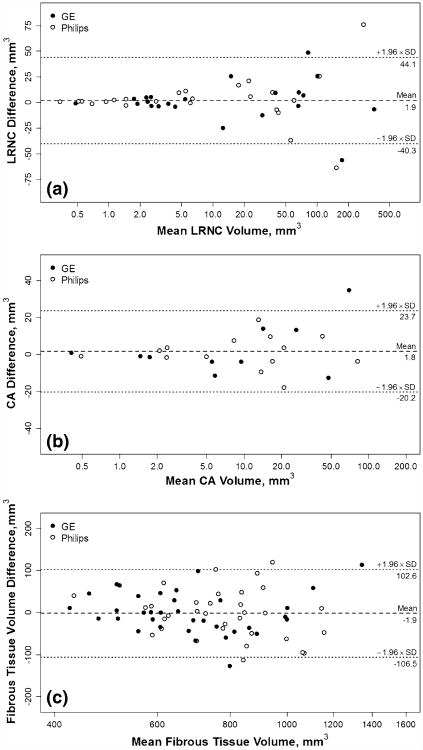
Fig. 3.
Bland–Altman plots on plaque composition. Bland–Altman plots are shown for LRNC volume (a), CA volume (b) and fibrous tissue volume (c). A logarithmic scale is used for the x-axis to aid visualization as the measurements spanned a wide range. Note that the actual values shown are on the original scale. Dashed lines indicate the mean difference and dotted lines indicate 95 % limits of agreement

