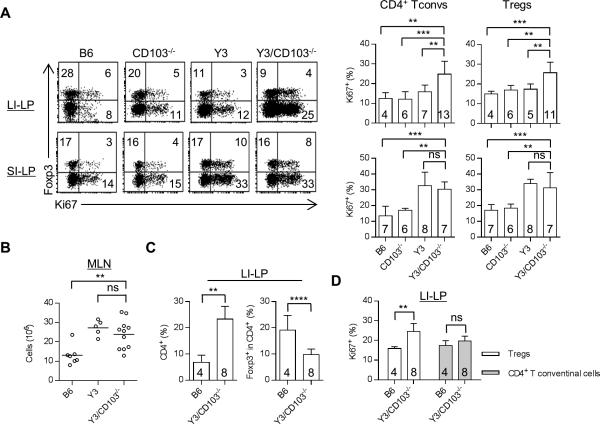
Figure 3. Increased Treg proliferation in Y3/CD103−/− mice.
(A) Representative (left) and averaged (right) Ki67 expression by CD4+ Foxp3− T conventional cells (Tconvs) and CD4+ Foxp3+ Tregs from the LI-LP and SI-LP. Age-matched 12-24 week-old mice were assessed for each genotype. (B-D) 6-10 week-old age-matched mice from each genotype were analyzed for MLN cellularity (B), the proportion of total CD4+ and CD4+ Foxp3+ Tregs in the LI-LP (C) and Ki67 expression by CD4+ Foxp3+ Tregs and CD4+ Foxp3− T conventional cells from the LI-LP (D). The number of mice/group is indicated within each bar or by individual symbols in scatter graphs.

