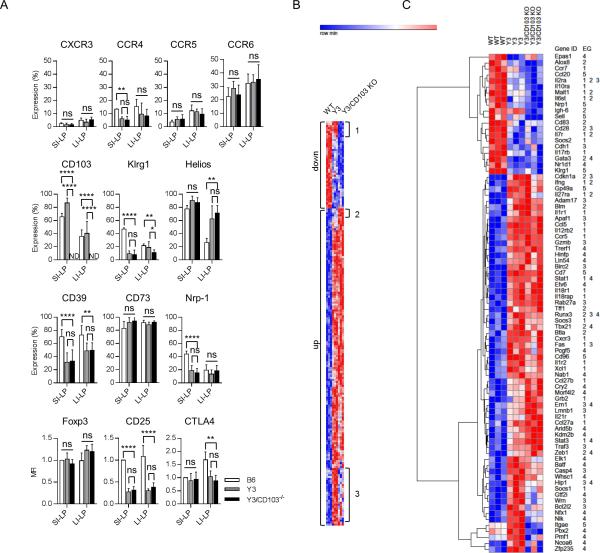
Figure 8. Similar gene programs in Y3 and Y3/CD103−/− Tregs.
(A) Expression of the indicated markers in Tregs from the SI-LP and LI-LP were assessed by flow cytometry (n ≥ 3 mice/group). (B) Euclidean cluster analysis of all differentially expressed genes (≥ 1.5-fold) for the indicated groups (n = 3 mice/group). (C) Euclidean clustering of genes within the major enrichment groups (EG). EG 1-5 are defined in the text of the Results. Age-matched 8-10 week-old mice were assessed for each genotype.

