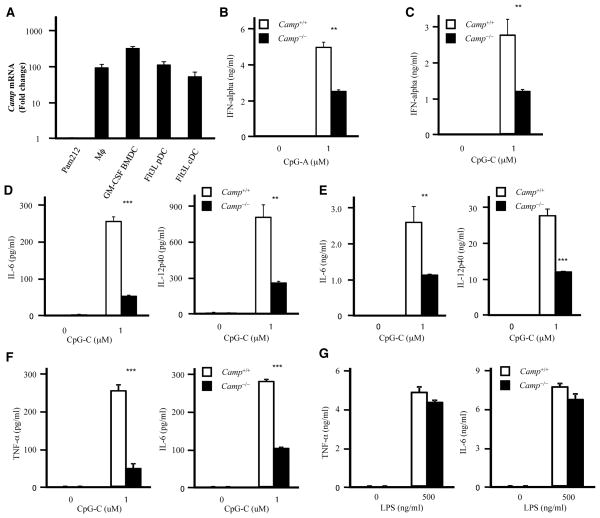
Figure 3. Impaired CpG responses in Camp−/− macrophages and dendritic cells.
A, Camp mRNA expression in macrophages and dendritic cells. Real-time PCR was used to quantify mRNA levels and fold change values are calculated relative to and normalized to Gapdh expression for Camp. Mϕ: thioglycollate-elicited peritoneal macrophage. B and C, Flt3L pDCs were stimulated with CpG-A (B) or CpG-C (C) for 15 h. IFN-α in the culture supernatants was measured by ELISA. D and E, Flt3L pDCs (D) or Flt3L cDCs (E) were stimulated with CpG-C for 15 h. The cytokine concentration in the supernatants was measured by ELISA. F and G, Thioglycollate-elicited peritoneal macrophages from WT and Camp−/− mice were stimulated with CpG-C (F) or LPS (G) for 15 h. The cytokine concentration in the supernatants was measured by ELISA.
**P < 0.01 ***P < 0.005. Data are representative of at least three independent experiments.

