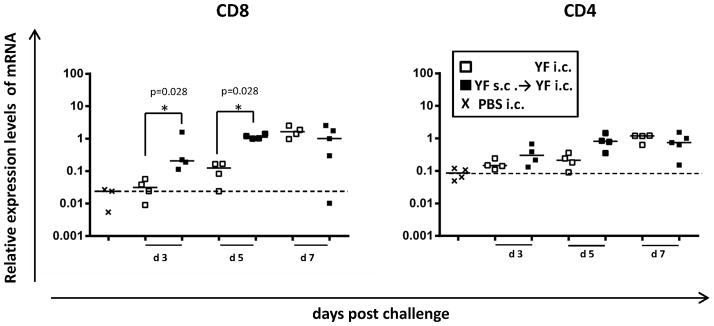
Figure 7. Expression levels of CD8 and CD4 mRNA in YF-17D infected brains.

mRNA expression levels in the brains of vaccinated (black squares) and non-vaccinated (open squares) WT B6 mice were compared at days 3, 5 and 7 post i.c. challenge. The mRNA level in the brain of an immunized mouse at day 7 post challenge is set to R = 1. mRNA levels in the brains of mice that had received a sham (PBS) i.c. injection (x) was used to determine the baseline mRNA expression for each molecule (dashed lines). Each dot represents an individual animal.
