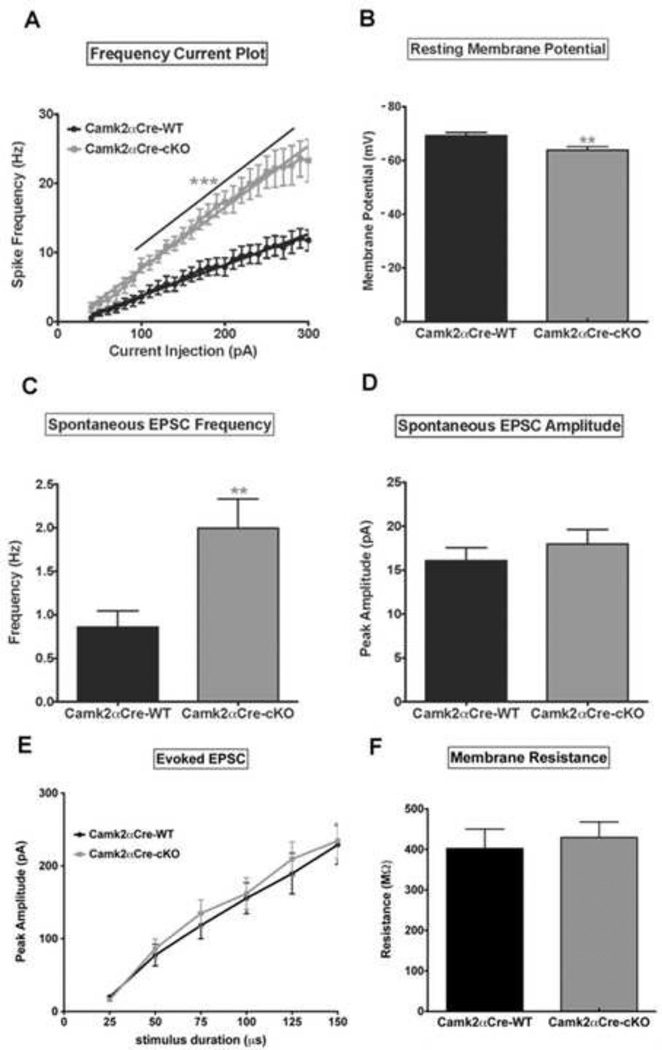
Figure 4. Loss of NMDA-R1 in pyramidal neurons leads to an increase in pyramidal cell excitability.
Patch clamp was used to determine the electrophysiological cellular properties of pyramidal neurons. A) Frequency-current (F–I) plot show an increase in spike frequency as a function of increasing current injection in both groups of mice. Note the significantly higher rate of spike frequency firing in Camk2αCre-cKO mice compared to Camk2αCre-WT mice (n=13 for each group, p<0.001, Sum-of-squares=8653, F=296.5. Two-way ANOVA with Bonferroni post-hoc). B) Pyramidal neurons from Camk2αCre-cKO mice are more depolarized at rest compared to the Camk2αCre-WT mice (Camk2αCre-WT=−69.21±1.24 mV, n=13; Camk2αCre-cKO=−63.88±1.31 mV, n=13; p=0.007, t=2.95). C, D) Pyramidal neuron spontaneous EPSC frequency (C) and peak amplitude (D) are both increased in Camk2αCre-cKO mice but the increase reached significance only for frequency (Frequency: Camk2αCre-WT=0.86±0.18 Hz, n=14; Camk2αCre-cKO=2.00±0.33 Hz, n=15; p=0.007, t=2.97. Peak amplitude: Camk2αCre-WT=16.08±1.48 pA, n=13; Camk2αCre-cKO=17.95±1.69 pA, n=15; p=0.418, t=0.823). E) There was no significant difference for peak amplitude of evoked EPSCs between the 2 groups (p=0.445, Sum-of-squares=1298, F=0.592. Two-way ANOVA with Bonferroni post-hoc). F) The Resistance did not differ significantly between the two groups of mice (Camk2αCre-WT=402.3 ± 47.99 n=14; Camk2αCre-cKO=429.6 ± 38.20 n=19; p=0.660; t=0.444). Statistical analysis in (B, C, D and F) were performed using an unpaired two tailed t-test followed by Welch’s post-hoc when appropriate (C) to correct for unequal variance. Significance after Bonferroni correction requires p=0.007. (* - p<0.05, ** - p<0.01, *** - p<0.001).

