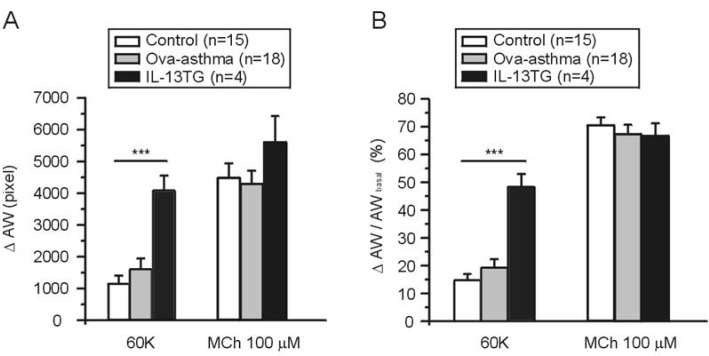
Fig. 3.
AW change (ΔAW) during 60K-contraction and 100 µM MCh application. Summary of ΔAW in Control (n=15), Ova-asthma (n=18) and IL-13TG (n=4) are displayed as bar graphs (mean±SEM). Numbers of tested slices are also directly indicated above the figure. Ova-asthma had a tendency of higher sensitivity to 60 K (***p<0.001) in both ΔAW area (pixel number) changes (A) and ΔAW normalized to each basal (B, ΔAW/AWbasal). However, there were no differences in the maximum stimulation of muscarinic receptor among three groups.

