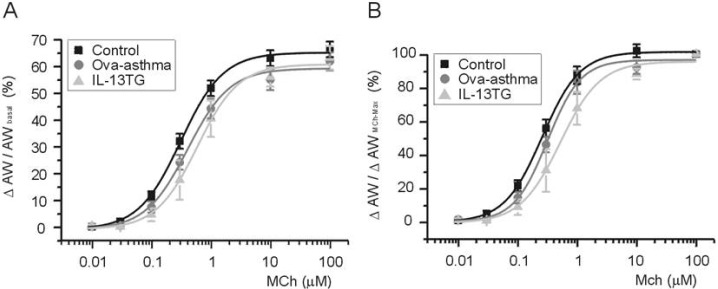
Fig. 4.
Pharmacological sensitivity of AW responses to muscarinic stimulations. Concentration-response curves to differential concentrations of MCh. For comparison between groups, ΔAW normalized to each basal (A, ΔAW/AWbasal) and to maximum ΔAW-induced by 100 µM MCh (B, ΔAW/AWMChMax). Number of tested slices for the each group is same with that of figure 3.

