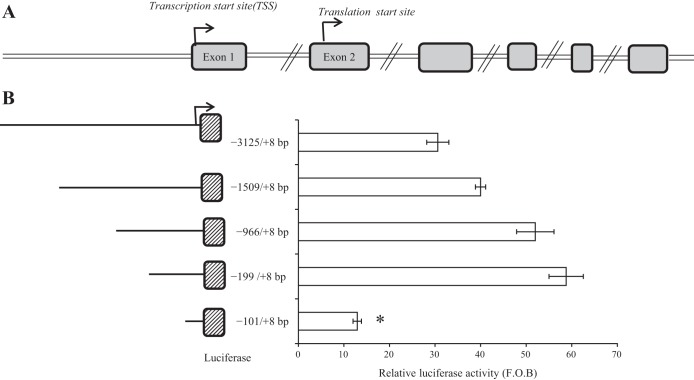
Fig. 1.
Diagrammatic representation of exons (A) and functional analysis of 5′-regulatory region of the SLC52A3 gene (B). A: 5′-rapid amplification of cDNA ends (5′-RACE) and bioinformatics analysis revealed that the transcription start site (TSS) is positioned in untranslated exon 1, whereas the TSS is on exon 2. B: functional analysis of the putative promoters. Left: size and position of the different promoter constructs. Right: luciferase assay results of the different constructs following transient transfection into HuTu 80. Firefly luciferase activity was normalized relative to the activity of simultaneously expressed Renilla luciferase in the cellular extracts. Results are expressed as relative fold to the pGL3-basic (F.O.B.) vector and represent means ± SE of at least 3 independent experiments. *P < 0.01.

