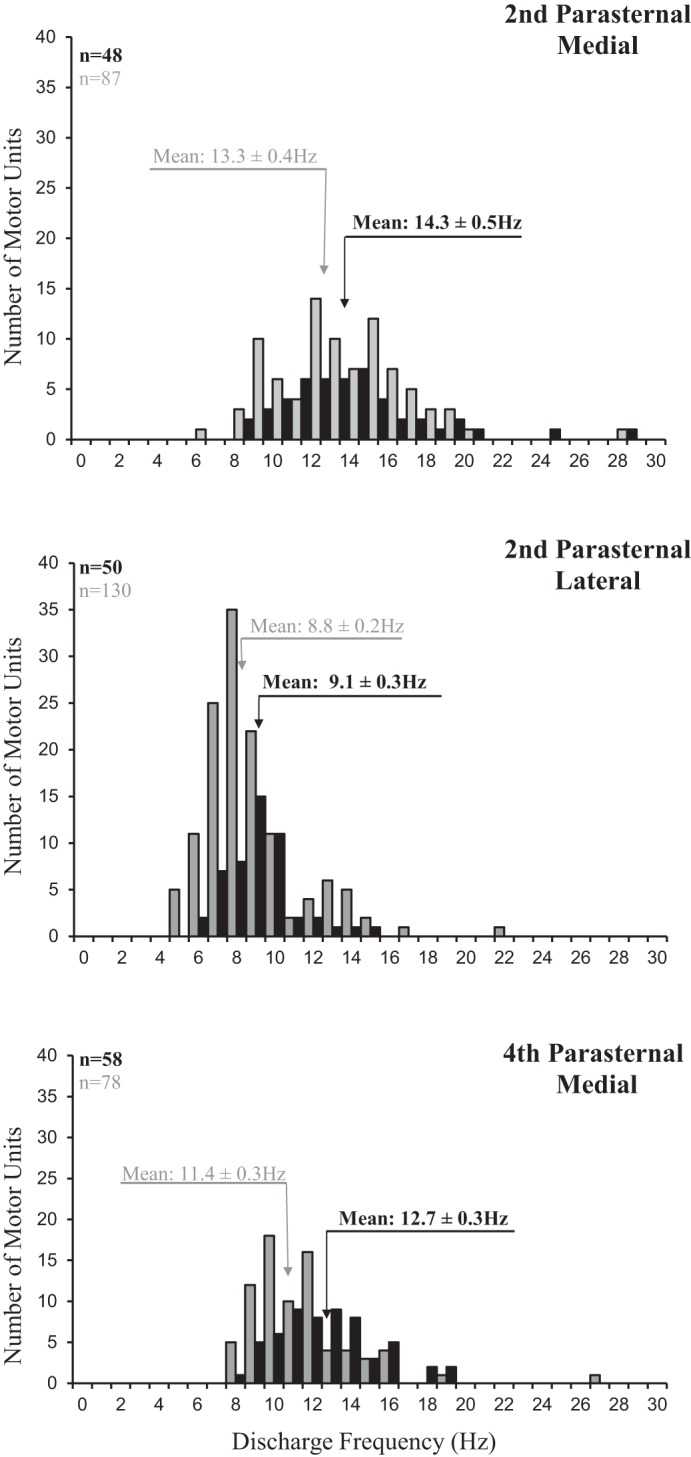
Fig. 4.

Histograms of the peak discharge frequencies of all single motor units identified in the medial bundles of the 2nd interspace (top panel), lateral bundles of the 2nd interspace (middle panel), and medial bundles of the 4th interspace (bottom panel) during spontaneous breathing (gray bars) and during HF-SCS (dark bars). Bin width, 1 Hz. Recordings were obtained under conditions in which rib cage expansion during HF-SCS was matched to that recorded during spontaneous breathing by adjustment of stimulus amplitude. See text for further explanation.
