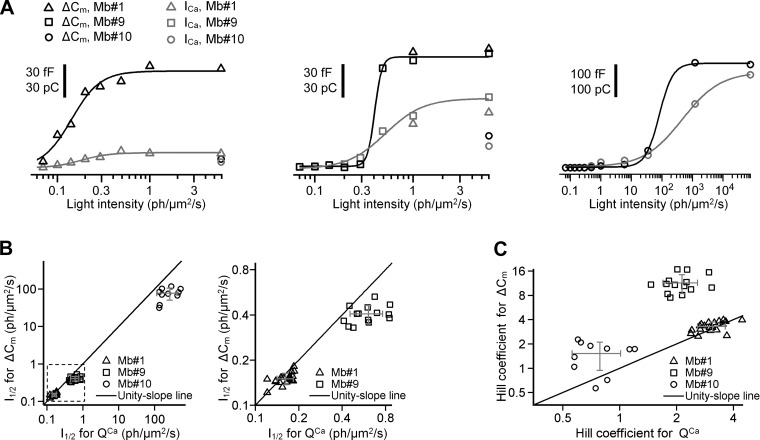
Fig. 8.
Exocytosis and Ca2+ influx triggered by light-evoked potentials. A: ΔCm (black) and QCa (gray) triggered by light-evoked potentials in axotomized Mb terminals 1 (left), 2 (center), and 3 (right). The initial capacitance of axotomized Mb terminals 1, 2, and 3 was 3.29, 4.38, and 2.71 pF, respectively. Fit was done with the Hill equation. For ΔCm, the intensity at half-maximal response (I1/2, in photons·μm−2·s−1) was 0.15 ± 0.01 for spiking potentials from Mb1, 0.41 ± 0.02 for graded potentials from Mb9, and 82 ± 25 for graded potentials from Mb10, whereas the Hill coefficients were 2.79 ± 0.50, 11.7 ± 2.9, and 1.9 ± 0.7, respectively. For QCa, I1/2 (in photons·μm−2·s−1) was 0.18 ± 0.02 for spiking potentials from Mb1, 0.52 ± 0.06 for graded potentials from Mb9, and 462 ± 70 for graded potentials from Mb10, whereas the Hill coefficients were 2.89 ± 0.83, 2.25 ± 0.50, and 0.70 ± 0.06, respectively. Note that spiking light-evoked potentials from Mb1 and the most light-sensitive graded potentials from Mb9 almost saturated exocytosis at similar level (∼90 fF) at similar light intensity (0.49 photons·μm−2·s−1). B, left: I1/2 (in photons·μm−2·s−1) for ΔCm vs. that of for QCa. Right: expanded area inside the dashed box shown on left. Note that for spiking potentials mean values of I1/2 for ΔCm and QCa were almost equal (P = 0.1). For graded potentials mean value of I1/2 for ΔCm was less than that of for QCa. C: Hill coefficient for ΔCm vs. that for QCa. Note that for spiking potentials mean values of the Hill coefficient for ΔCm and QCa were not significantly different (P = 0.1). For graded potentials, the mean value of the Hill coefficient for the ΔCm was greater than that for the QCa (P = 10−7 for Mb10 and P = 0.05 for Mb10). Gray error bars in B and C show SD about the mean.

