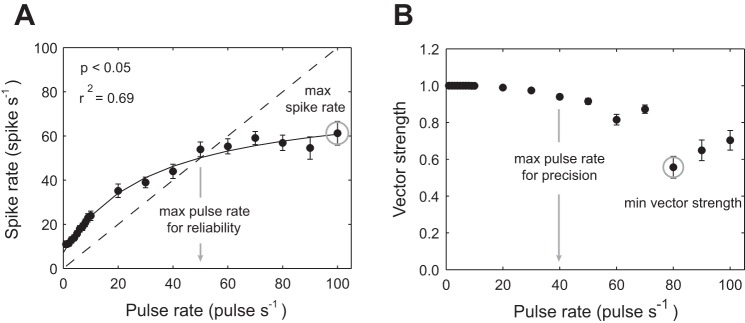
Fig. 7.

Measurements of spike rate and vector strength for afferent responses to pulse stimuli. A: solid line indicates fitted values for Eq. 1, showing that spike rate increases asymptotically with pulse rate. Dashed line represents the 1:1 ratio of spikes to pulses. Values that fall below this line indicate that, for the given pulse rate, each pulse does not elicit a spike response. Thus the intersection between the solid and dashed line sets the maximum pulse rate for which our definition of reliability in maintained (gray arrow). Gray circle represents the maximum spike rate observed. B: vector strength of the response (using the initial spike, see methods) across pulse rates, where the gray circle represents the minimum vector strength observed. All values are means ± SE. Equations are described in the methods.
