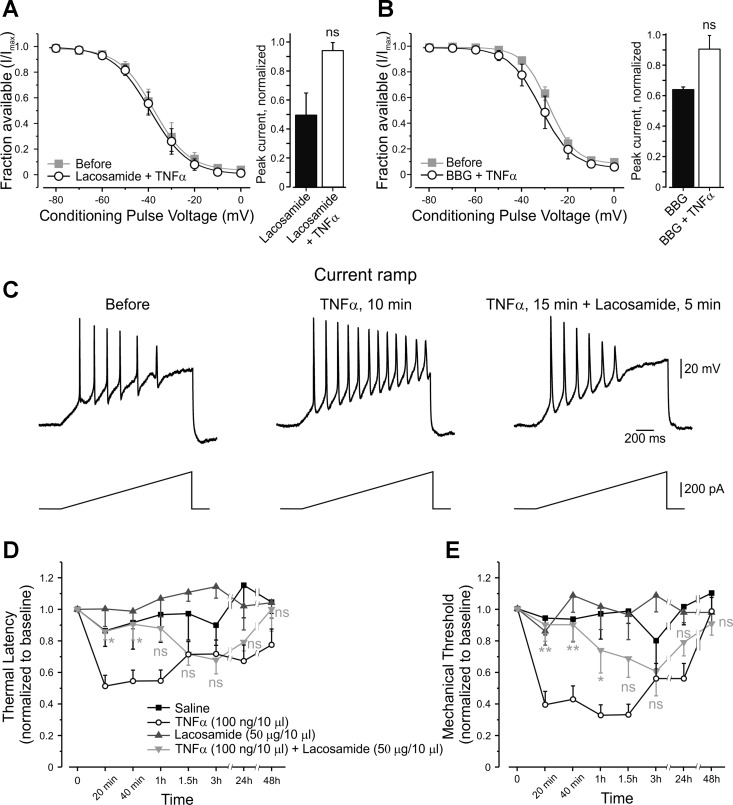
Fig. 10.
Pharmacological enhancement of voltage dependence of slow inactivation reverses the TNF-α-mediated relief of slow inactivation and diminishes the effect of TNF-α on nociceptive excitability. A, left: voltage dependence of slow inactivation of TTX-r sodium currents, expressed as peaks of TTX-r sodium currents during a step to 0 mV, normalized to Imax (fraction available, means ± SE) and plotted against conditioning voltages before (gray squares) and after application of TNF-α, together with lacosamide (open circles). Note: there was no change in voltage dependence of slow inactivation (see Table 2 for V1/2,slope values and statistical analysis, n = 8). A, right: the ratio of peak TTX-r sodium current before application of treatment (INa,control) to the peak current after the treatment (INa,treatment) with lacosamide and lacosamide + TNF-α. Values are means ± SE, n = 10; P = 0.32, compared with the control, one-sample t-test. B, left: voltage dependence of slow inactivation of TTX-r sodium currents, before (gray squares) and after application of TNF-α, together with brilliant blue G (BBG) (open circles). Note: there was no change in voltage dependence of slow inactivation (see Table 2 for V1/2,slope values and statistical analysis, n = 4). B, right: the ratio of peak TTX-r sodium current before application of treatment (INa,control) to the peak current after the treatment (INa,treatment) with BBG and BBG + TNF-α. Values are means ± SE, n = 4, P = 0.6, compared with the control, one-sample t-test. C, top: representative traces of current clamp recordings from the same nociceptor-like DRG neuron, following 500 pA, 1.5-s depolarizing ramps in control condition (left trace), 10 min after application of TNF-α (middle trace) and 5 min after application of lacosamide on top of 10 min application of TNF-α (right trace). See Table 4 for the numerical data and statistical analysis. Bottom: stimulation protocol. D: latency for paw withdrawal from hot plate (52°C), normalized to baseline, after intraplantar injection of saline (black squares); TNF-α alone (open circles); lacosamide alone (gray triangles); or TNF-α applied together with lacosamide (light gray inverted triangles). The values are means ± SE. Time point “0” refers to the baseline. Gray asterisks, comparison between the TNF-α group to TNF-α + Lacosamide group; ns, P > 0.05, *P < 0.05, two-way ANOVA followed by Bonferroni posttest, n = 6 for each group. E: mechanical threshold for paw withdrawal, normalized to baseline, obtained by von Frey filaments. The values are means ± SE, n = 6 for each group. Time point “0” refers to the baseline. Symbols are as in E; **P < 0.01.

