Fig. 3.
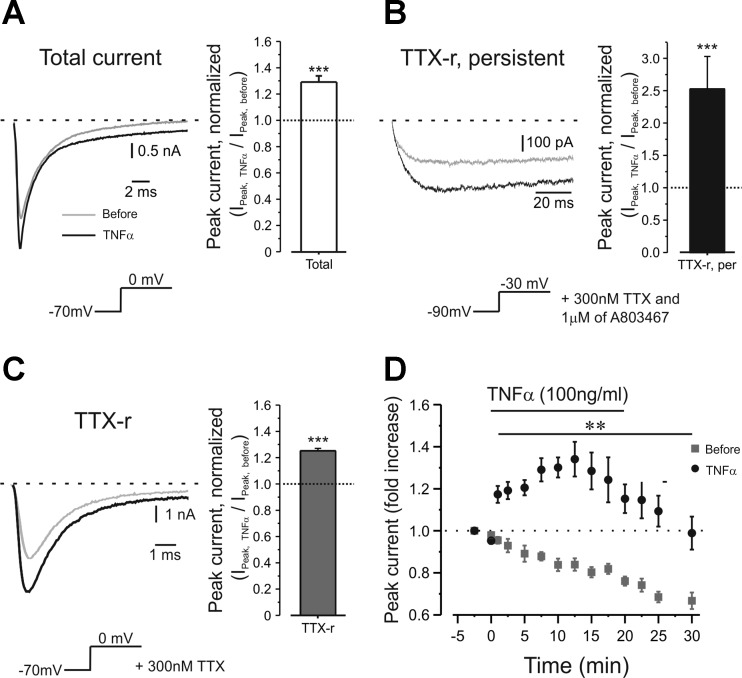
TNF-α increases the amplitude of tetrodotoxin-resistant (TTX-r) slow and TTX-r persistent sodium currents in nociceptor-like DRG neurons. A–C, left: representative traces of total (A), persistent TTX-r (B) and slow TTX-r (C) sodium currents recorded from the same neuron before (gray traces) and 1 min after application of TNF-α (black traces). The currents were elicited by protocols represented in the inset beneath the traces (for the detailed protocols, see materials and methods). The dashed line indicates the zero current level. Currents are adjusted according to the baseline before the activation step. Traces (150 μs) were blanked to remove residual uncompensated capacitance transient currents. Note the different scale bars between A, B and C. Right: ratio of the peak of total (A), persistent TTX-r (B) and slow TTX-r (C) sodium currents after TNF-α application (Ipeak,TNF-α) to the peak current before (Ipeak,before) from all measured cells (means ± SE, nTotal = 14, nTTX-r per = 5, nTTX-r = 30, paired t-test, ***P < 0.001). Dotted lines indicate the level of Ipeak,before. D: time course of changes of the peak amplitude of TTX-r sodium current assessed by 150-ms depolarizing steps from −70 mV to 0 mV during a 20-min application of TNF-α (black circles) or vehicle (gray squares) (n = 11 for time points −2.5 to 17.5; n = 7 for time point 20; n = 5 for time points 25 to 30; means ± SE). Time point −2.5 refers to data collected shortly after establishing the whole cell configuration when vehicle was applied. Time points 0 to 20 indicate time of application of TNF-α. Note fast onset of the effect of TNF-α (1 min) and decrease in sodium current amplitude when recorded without TNF-α (n = 9 for time points −2.5 to 10; n = 6 for time point 12.5 to 30; n = 5 for time points 25 to 30; means ± SE). Peak current normalized to peak current amplitude detected at −2.5 time point (3.1 ± 1.1 nA for the TNF-α group, 3.2 ± 0.6 nA, for the vehicle group, **P < 0.01, two-way ANOVA, n = 30) is marked by dashed line.

