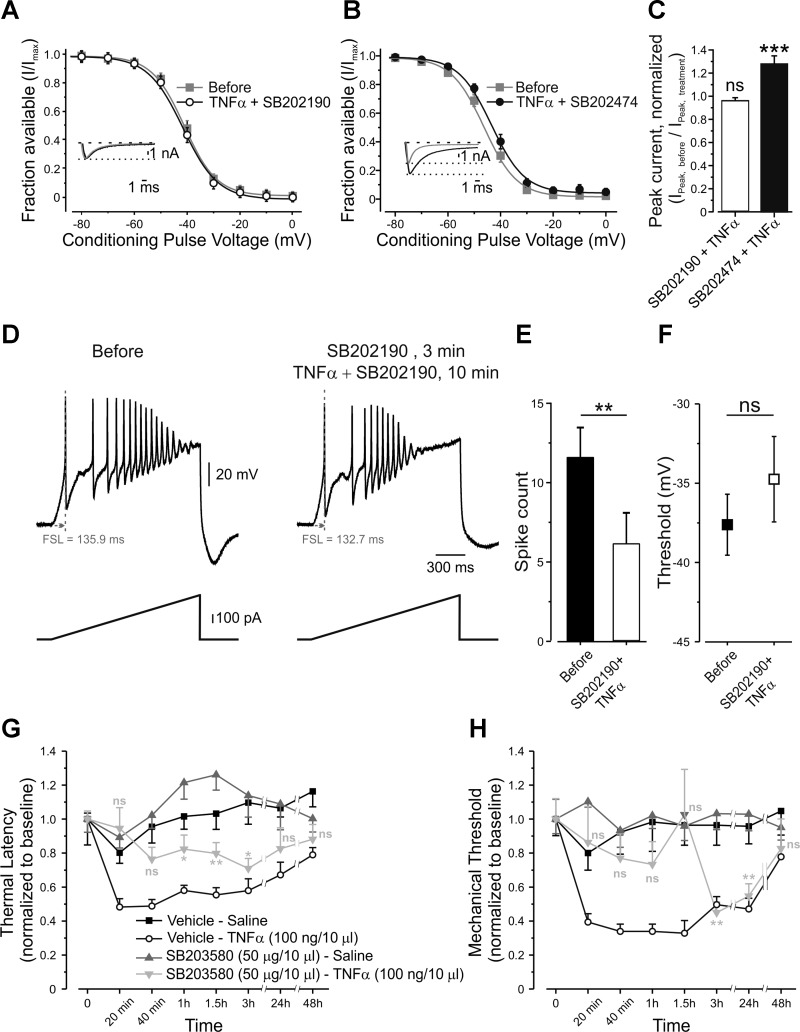
Fig. 8.
TNF-α-mediated relief of voltage dependence of slow inactivation and increase in nociceptive excitability requires p38 MAPK. A: voltage dependence of slow inactivation of TTX-r sodium currents, expressed as peaks of TTX-r sodium currents during a step to 0 mV, normalized to Imax (fraction available, means ± SE) and plotted against conditioning voltages, before (gray squares) and 2 min after application of p38 MAPK antagonist SB202190, followed by a 1-min coapplication with TNF-α (open circles, paired t-test between the values of V1/2,before and V1/2,TNF-α, P > 0.05, n = 14, see also Table 2). Inset: representative traces of TTX-r sodium currents, recorded in the presence of TTX, elicited by 150-ms steps from a holding potential of −70 mV to 0 mV before (gray) and 2 min after application of p38 MAPK antagonist SB202190, followed by a 1 min coapplication with TNF-α (black). Currents are adjusted according to the baseline before the activation step. The dashed line indicates the zero current level. The dotted line indicates the peak current level before application of TNF-α. B: voltage dependence of slow inactivation of TTX-r sodium currents, assessed as explained in A, before (gray squares) and 2 min after application of the inactive analog, SB202474, followed by a 1-min coapplication with TNF-α (black, paired t-test between the values of V1/2,before and V1/2,TNF-α, P < 0.0001, n = 18; see also Table 2). Inset: representative traces of TTX-r sodium currents, recorded in the presence of 300 nM TTX, elicited by 150-ms steps from a holding potential of −70 mV to 0 mV before (gray) and 2 min after application of the inactive analog SB202424, followed by 1-min coapplication with TNF-α (black). The dashed line indicates the zero current level. The dotted line indicates the peak current level before application of TNF-α. C: the ratio of peak TTX-r sodium current before application of treatment (INa,before) to the peak current after application (INa,treatment) of SB202190 + TNF-α (n = 14) and SB202474 + TNF-α (n = 18). The values are means ± SE; ns, P > 0.05, ***P < 0.001, one-sample t-test comparing the values before and after the application of treatment. D: representative traces of current clamp recordings from the same nociceptor-like DRG neuron, following 500 pA, 1.5-s depolarizing ramps before (left) and 3 min after application of p38 MAPK antagonist SB202190, followed by a 10-min coapplication with TNF-α (right). FSL, first spike latency. E: SB202190 prevents the effect of TNF-α on spike count (means ± SE, **P < 0.01, paired t-test, n = 8) and threshold for generation of AP (F) (means ± SE, ns, P > 0.05, paired t-test, n = 8). G: latency for paw withdrawal from hot plate (5°C), normalized to baseline, after intraplantar injection of vehicle followed, 20 min later, by intraplantar injection of saline (Vehicle-Saline, black squares); intraplantar injection of vehicle followed, 20 min later, by intraplantar injection of TNF-α (Vehicle-TNF-α, open circles); intraplantar injection of p38 MAPK inhibitor, SB203580, followed, 20 min later, by intraplantar injection of saline (SB203580-Saline, gray triangles); or intraplantar injection of SB203580 followed by intraplantar injection of TNF-α (SB203580-TNF-α, light gray inverted triangles). The values are means ± SE. Time point “0” refers to the baseline. Gray asterisks, comparison between SB203580-Saline group to SB203580-TNF-α group. ns, P > 0.05; **P < 0.01; *P < 0.05; two-way ANOVA followed by Bonferroni post-test, n = 6 for each group. H: mechanical threshold for paw withdrawal, normalized to baseline, obtained by von Frey filaments. Time point “0” refers to the baseline. Symbols are as in G.

