
Figure 1.
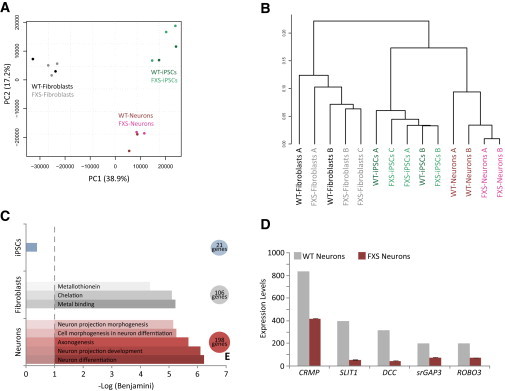
Differentially Expressed Genes in FXS versus Control Cells
(A) PCA on total gene expression profiles of control (WT) and FXS-derived cells shows clustering by cell type.
(B) The same profiles were used for hierarchical clustering using Pearson correlation exhibiting fibroblasts, iPSCs, and neurons to group apart.
(C) Downregulated genes in FXS iPSCs, fibroblasts, or neurons, which passed a statistically significant threshold of differential expression, were analyzed for different cellular processes or pathways using Functional annotation clustering with the DAVID functional annotation clustering tool (http://david.abcc.ncifcrf.gov/). FXS iPSCs showed no significant GO term enrichment for downregulated genes. Downregulated genes in FXS fibroblasts exhibit a significant enrichment for metal binding proteins while FXS-derived neurons display a significant enrichment for axonogenesis and neuron differentiation.
(D) DNA-microarray analysis revealed several axonal guidance genes with markedly lower expression levels in FXS-derived neurons compared with control (WT) (columns represent average values of two control microarrays for WT and three FXS microarrays for FXS; scale bars represent SE).