
Figure 2.
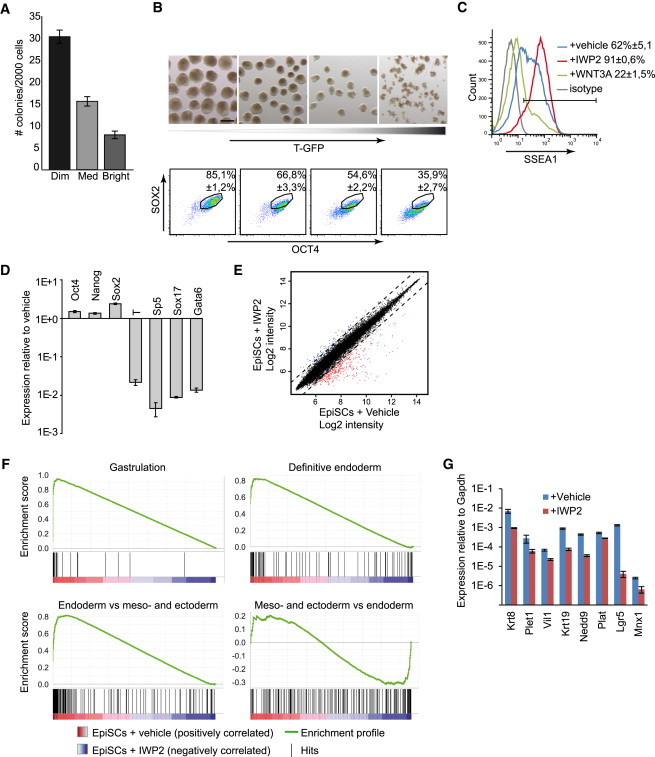
Endogenous WNT Proteins Induce Loss of Pluripotency in EpiSCs
(A) T-GFP EpiSCs were sorted into three categories based on GFP and assayed for their ability to establish NANOG-positive colonies (three independent experiments, mean ± SEM).
(B) T-GFP EpiSCs were sorted into four categories based on GFP and assayed for their ability to establish EBs (top) or analyzed by flow cytometry for SOX2 and OCT4 (bottom, three independent experiments, mean ± SEM).
(C) Flow cytometry histogram showing T-GFP EpiSCs treated for 3 days with the indicated factors and analyzed for SSEA1 (three independent experiments, mean ± SEM).
(D) Real-time RT-PCR gene expression profiles of 129S2C1a EpiSCs cells treated for 3 days with IWP2, plotted relative to untreated EpiSCs (three independent experiments, mean ± SEM).
(E) Scatter plot comparing the global gene expression levels of GFP9 EpiSCs cultured in the presence or absence of IWP2. The dotted lines delineate the boundaries of 2-fold difference in gene expression levels. Genes expressed more than 2-fold higher or lower in the presence of IWP2 are plotted in blue or red, respectively.
(F) Gene set enrichment analysis plots demonstrating the enrichment of the indicated gene sets in EpiSCs cultured in the absence versus the presence of IWP2.
(G) RT-PCR analysis for definitive endoderm genes in EpiSCs, in response to IWP2 (three biological replicates using 129S2C1a, Axin2LacZ, and GFP9 EpiSCs, mean ± SEM).
Scale bar represents 200 μm. See also Figure S2.