
Figure 3.
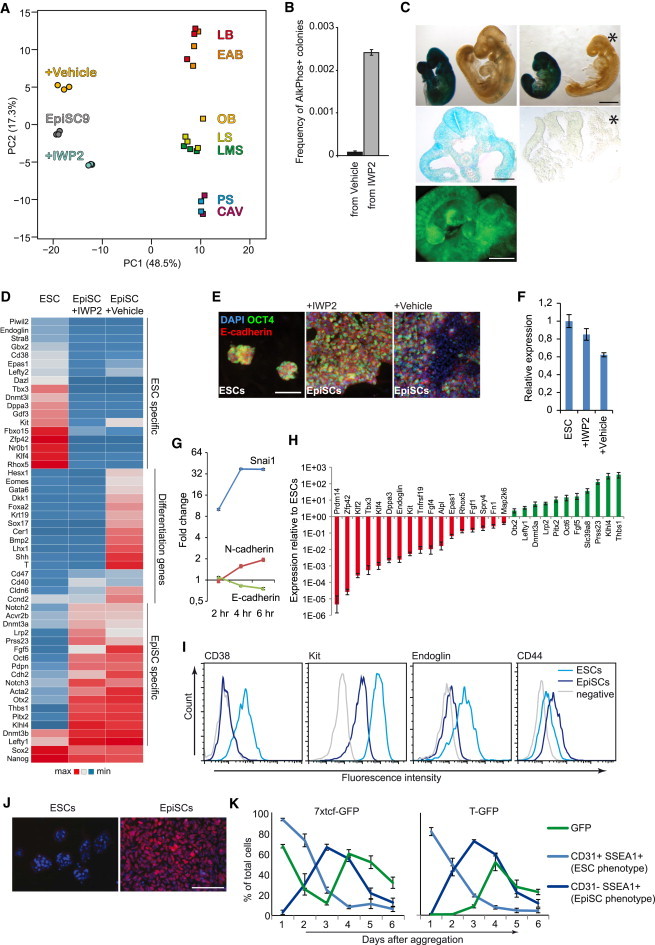
WNT Inhibition Maintains EpiSCs in a Pregastrula Epiblast Stage
(A) Transcriptomes from primary epiblasts dissected from embryos ranging from cavity to late bud stages and from the EpiSC line EpiSC9 were obtained from GEO (GSE46227) and combined with six microarray gene expression data sets from GFP9 EpiSCs cultured with and without IWP2 and analyzed by principal component analysis. The percentage of variance explained by the principal components is indicated between parentheses.
(B) Reversal efficiency of T-GFP EpiSCs. Prior to start of the reversal experiment, the cells were maintained in the presence or absence of IWP2 as indicated (n = 3, mean ± SEM).
(C) (Upper) X-gal stained chimeras derived from blastocyst injections of passage 5 Rosa26-LacZ EpiSCs. (Middle) Sections to indicate EpiSC contribution (blue). Asterisk indicates a nonchimeric littermate. (Lower) Chimera derived from blastocyst injections of passage 5 GFP9 EpiSCs. Green fluorescence indicates EpiSC contribution.
(D) Heat map of selected gene expression levels of ESCs and GFP9 EpiSCs cultured in the presence or absence of IWP2 and analyzed by microarray.
(E) E-CADHERIN and OCT4 immunofluorescence images of EpiSCs and ESCs.
(F) RT-PCR for E-cadherin in EpiSCs and ESCs (three biological replicates using 129S2C1a, Axin2LacZ, and GFP9 EpiSCs, mean ± SEM).
(G) Time course RT-PCR analysis of indicated genes in GFP9 EpiSCs following treatment with WNT3A (n = 3, mean ± SEM).
(H) Real-time RT-PCR gene expression analysis of FVB EpiSCs relative to ESCs for a range of genes found by microarray to be differentially expressed between EpiSCs and ESCs (n = 3, mean ± SEM).
(I) Flow cytometry histograms showing surface markers distinguishing ESCs (CD38, KIT, and ENDOGLIN) and EpiSCs (CD44).
(J) OCT6 immunostaining (red) of 129S2C1a EpiSCs and ESCs (blue, DAPI).
(K) The indicated ESC lines were aggregated into EBs and analyzed daily by flow cytometry for expression of reporter and the indicated cell surface markers (three independent experiments, mean ± SEM).
Scale bar represents 1 mm (C, embryos), 200 μm (C, section), 100 μm (E and J). See also Figure S3.