
Figure 4.
Inhibition of Endogenous WNT Signals Prevents Accumulation of Differentiated Cells in hESC Cultures
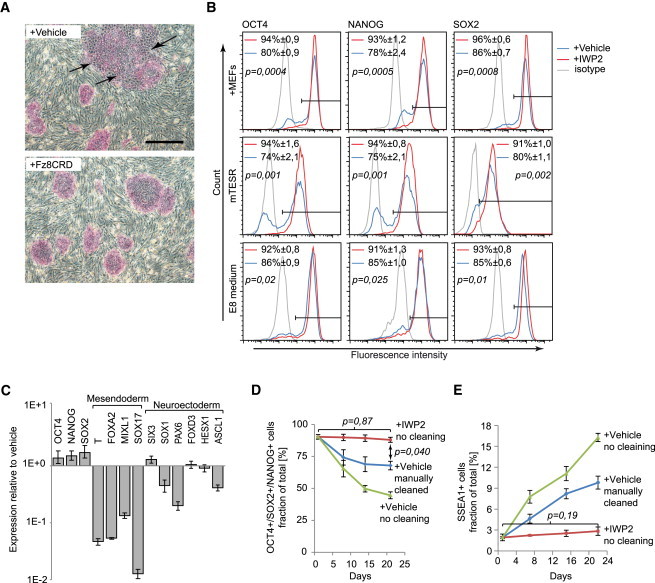
(A) H1 hESCs cultured for 5 days at the indicated conditions and stained for alkaline phosphatase (red). Arrows indicate differentiating areas of the colonies.
(B) Flow cytometry histograms showing H1 hESCs cultured for 7 days in the presence or absence of IWP2 and analyzed for NANOG, OCT4, and SOX2 (three independent experiments, mean ± SEM).
(C) Real-time RT-PCR gene expression profiles of H1 hESCs cultured for 6 days in the presence of IWP2, plotted relative to untreated cells (n = 3, mean ± SEM).
(D) Percentage of H1 hESCs triple positive for NANOG, OCT4, and SOX2 in the indicated conditions and procedures (three independent experiments, mean ± SEM).
(E) Percentage of H1 hESCs expressing SSEA1 in the indicated conditions and procedures (three independent experiments, mean ± SEM).
Scale bar represents 500 μm. See also Figure S4.