
Figure 2.
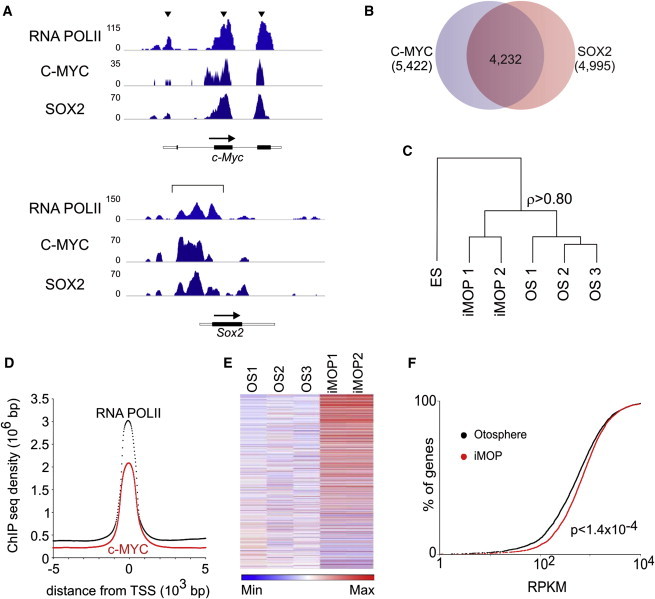
Binding Sites of C-MYC and SOX2 and Target Gene Transcript Levels in iMOP cells
(A) Differential binding of C-MYC and SOX2 near RNA-POLII-binding regions at the c-Myc and Sox2 genes shows enrichment patterns near promoters of c-Myc splice variants and Sox2.
(B) C-MYC binds to ∼85% (4,231/4,994) of SOX2 target genes.
(C) Hierarchical clustering analysis of RNA-seq samples from ESCs, iMOP cells, and otospheres (OS) using all expressed genes. Numbered samples denote RNA-seq data from individual cell lines. iMOP cells and otospheres show a high degree of correlation (Spearman’s rank correlation ρ > 0.80)
(D) Quantile normalized RNA POLII and C-MYC ChIP-seq densities map ±5 kb around the TSS.
(E) Relative gene expression from SOX2 and C-MYC target genes. RPKM are plotted for each gene from three otosphere samples (OS) and two iMOP samples. RPKM are plotted for each gene and the relative read counts are denoted by color. The maximum fold increase is 5,540 and the mean and median fold increases are 4.7 and 1.3, respectively.
(F) SOX2 and C-MYC target genes. The cumulative distribution of normalized reads from averaged otosphere and iMOP samples is shown. C-MYC and SOX2 target genes with 1–104 RPKM from otosphere and iMOP samples were plotted. The difference between the two samples is statistically significant using Welch’s two-tailed t test (p < 1.4 × 10⁻⁴).