
Figure 3.
Transcriptome Comparison of iMOP and Otosphere Cells
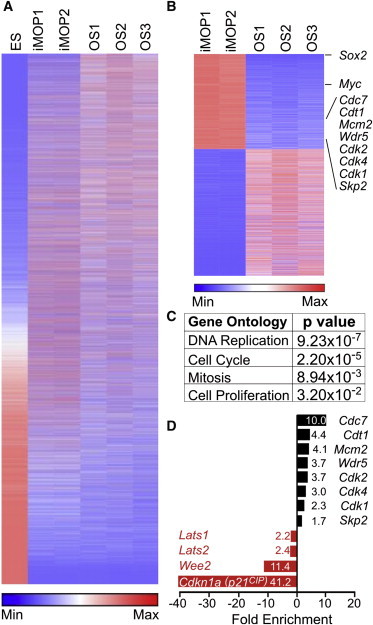
(A) Heatmap of detectable transcripts from ESC, iMOP, and otosphere (OS) RNA-seq samples, plotted with relative read counts depicted by color.
(B) Differentially expressed genes from pairwise comparison between averaged iMOP samples and otospheres. Genes that displayed statistically significant differences (p < 0.05) were identified. Individual C-MYC and SOX2 target genes are noted on the heatmap on the right.
(C) Functions of differentially expressed genes (p < 0.05) from iMOP and otosphere samples. The table shows pertinent biological processes based on Gene Ontology analysis and the associated p value.
(D) Differential expression of significantly altered genes (p < 0.05) from Gene Ontology analysis from pairwise comparison of iMOP and OS samples.