
Figure 5.
Molecular Profiling of iMOP Cells after bFGF Withdrawal
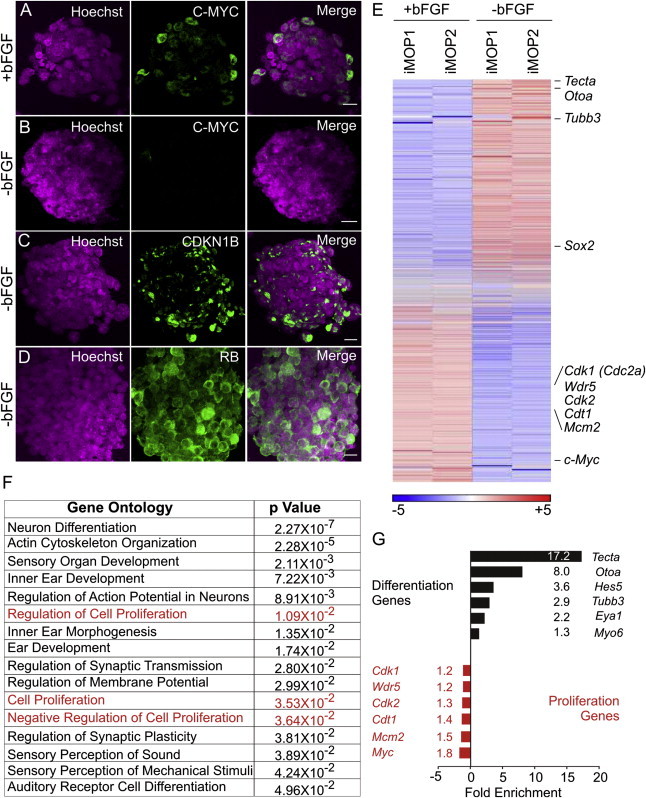
(A) Nuclei of iMOP cells marked by Hoechst staining and C-MYC marked with antibody label. In the presence of bFGF, cells expressed C-MYC.
(B) Removal of bFGF downregulated C-MYC expression.
(C and D) Removal of bFGF also caused expression of the cell-cycle inhibitory proteins (C) CDKN1B(p27KIP) and (D) RB. Scale bars represent 10 μm.
(E) Heatmap of all detectable genes in iMOP cells in the presence or absence of bFGF. Individual genes are listed on the right.
(F) Gene Ontology analysis of differentially expressed genes (p < 0.05) revealed changes in proliferation (highlighted in red) and neuronal and otic differentiation.
(G) Changes in expression levels of individual genes taken from the Gene Ontology analysis.