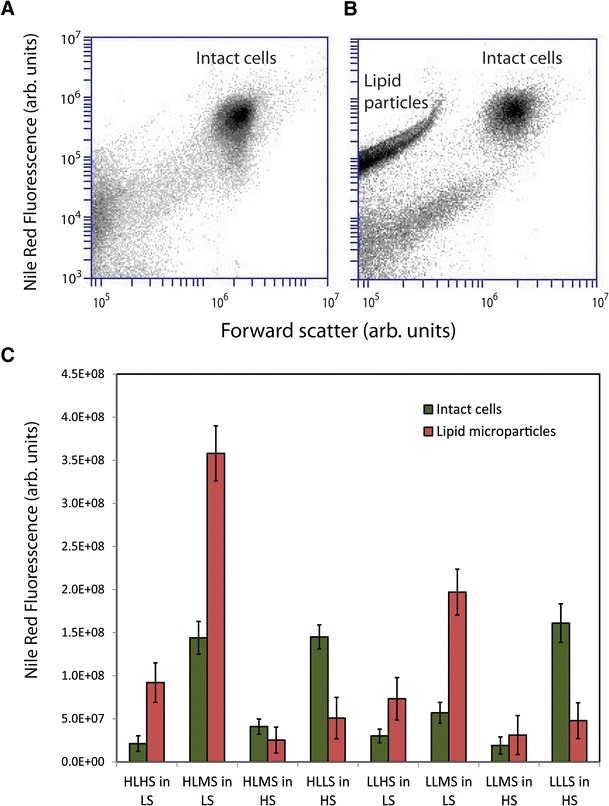
Fig. 6.

Lipid microparticle release under osmotic drift. a Flow cytometry scatter plot for total lipid (as indicated by Nile Red fluorescence intensity) versus particle diameter (as indicated by forward scatter) for the first day of osmotic shock in the HL×MS culture. b Repeat scatter plot for the fourth day of osmotic shock, corresponding to the second harvesting increment. c Summary of the total lipid content in the intact cell and lipid microparticles as indicated by Nile Red fluorescence, error bars indicate 1 − σ standard deviations (n = 3)
