
Figure 2.
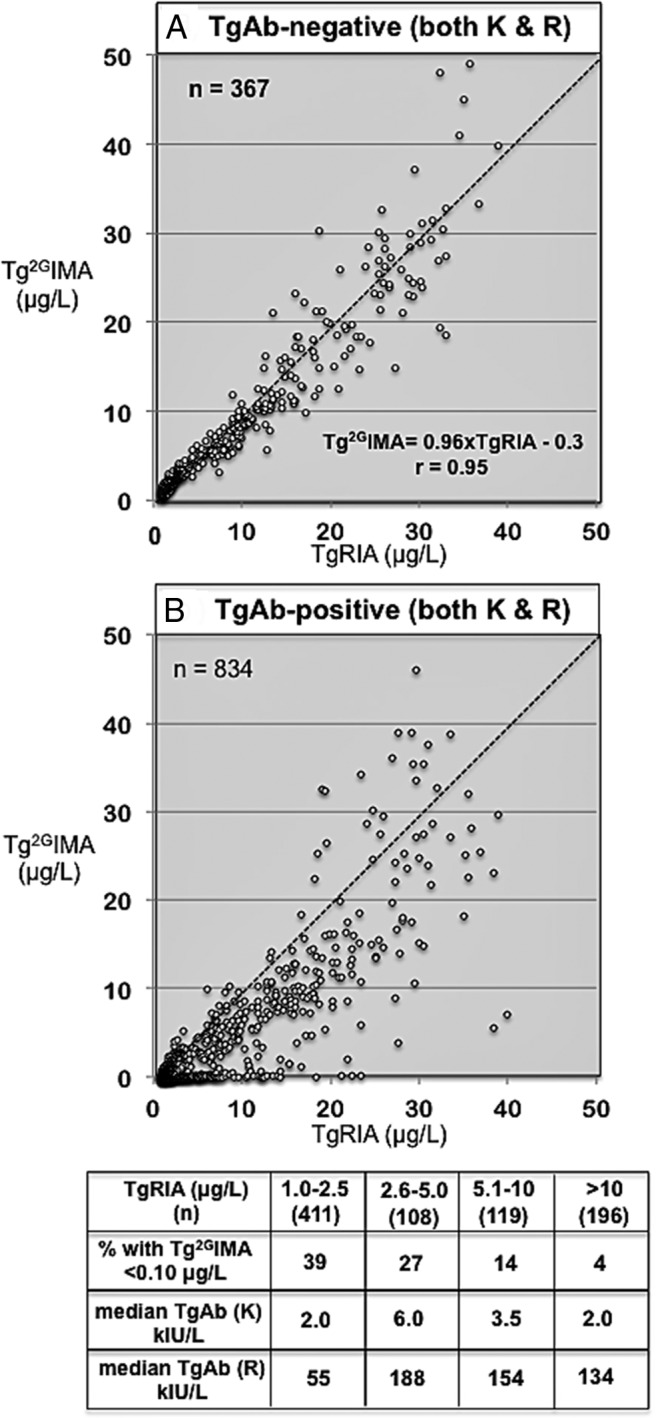
A, Relationship between TgRIA (abscissa) and Tg2GIMA (ordinate) for the 367 group B sera that were classified as TgAb negative according to the FS cutoff of both methods K and R. B, Relationship between TgRIA (abscissa) and Tg2GIMA (ordinate) for the 834 group B sera that were classified as TgAb-positive according to the FS cutoff of both methods K and R. The table below shows the median TgAb for methods K and R, and the percentage of severe interferences (Tg2GIMA of <0.10 μg/L) seen when TgAb-positive group B sera were analyzed according to TgRIA values (1.0–2.5, 2.6–5.0, 5.1–10, or >10 μg/L).