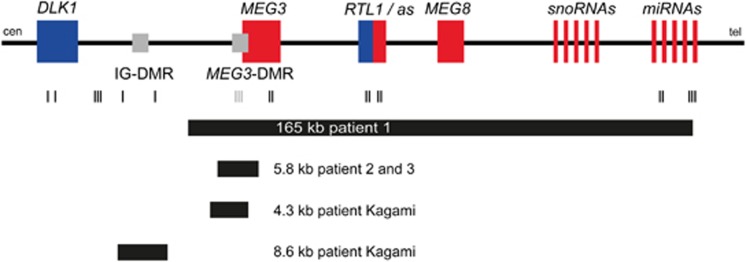
Figure 1.
Schematic overview of the imprinted region on chromosome 14q32. The scheme depicts the deletions described here (patients 1, 2 and 3) and in a previous report by Kagami et al.19 in relation to the imprinted genes in the region 14q32. The MS-MLPA probes of the region are indicated by black and gray lines. Black lines represent MLPA probes for dosage; gray lines represent MLPA probes for dosage and methylation. Blue, paternally expressed genes; red, maternally expressed genes; gray, DMRs (differentially methylated regions). Not drawn to scale.

