
Fig. 3.
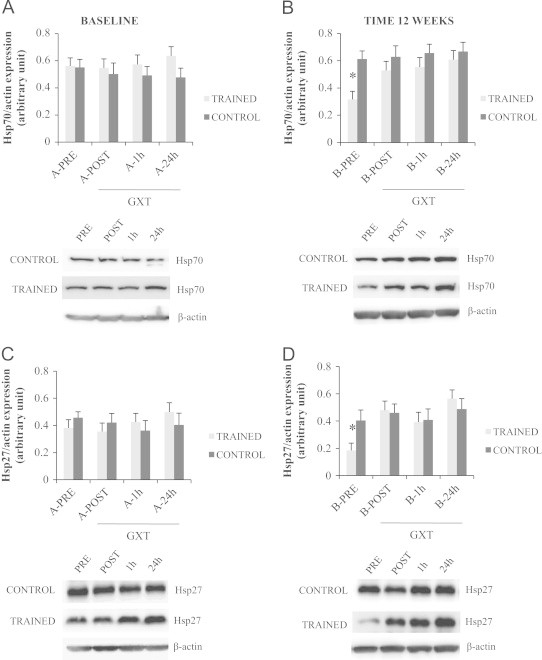
Effect of EMRT and GXT on Hsp27 and Hsp70 levels. The heat shock proteins 27 and 70 content were measured by Western blot analysis in PBMCs before (subset A) and after (subset B) the 12 weeks experimental time. Both subsets underwent a graded maximal exercise stress test (GXT). Gray bars: subjects performing the EMRT protocol. Black bars: control subjects. Protein expression was measured as the ratio between the optical density (OD) of marker protein and the OD of β-actin. In each panel, images show immunoblot results from the same representative subject, while the histograms represent the mean±SE; n=8. *p<0.05 vs. each other experimental point between groups and within the group.