. 2014 Dec 29;3:e03416. doi: 10.7554/eLife.03416

Figure 5. PD-1 expression is maintained by PIT and is required for tolerance.

(A) Representative histograms of PD-1 expression by CD4+ Tg4 cells sampled as naïve cells, Teff on day of transfer and Teff cells retrieved 4 days after PBS/PIT. (B) PD-1 expression (MFI) gated on CD4+ host cells and Tg4 donor cells from spleen 4 days after treatment (four mice per group, from one of four experiments giving consistent results, dotted line represents MFI of isotype control staining). (C) Time course of PD-1 expression on CD4+ Tg4 donor cells from PBS/PIT-treated mice (four mice per group). (D) B10.PLxC57BL/6 mice received PBS/PIT 1 day after transfer of Tg4 Teff cells. 4 days later CD4+ Tg4 donor cells were FACS-sorted and 2 × 10⁶ were transferred into secondary hosts that were not exposed to PIT (PTX was given on the same day). (E) EAE in secondary hosts (n = 4 for PBS; 21 for PIT, pooled from two experiments). (F) PD-1 expression gated on CD4+ Tg4 donor cells from spleens isolated 16 days after secondary transfer (dotted line represents MFI of isotype control staining). (G) EAE in B10.PLxC57BL/6 mice that received PBS/PIT 1 day after transfer of Teff generated from Tg4.PD-1+/+ or Tg4.PD-1−/− donors (n = 20–36 mice per group, pooled from three experiments).

DOI: http://dx.doi.org/10.7554/eLife.03416.011

Figure 5.

Figure 5—figure supplement 1. Elevated accumulation of Tg4.PD-1−/− Teff cells following PIT.

Figure 5—figure supplement 1.

B10.PLxC57BL/6 mice received PBS or PIT 1 day after transfer of Tg4.PD-1+/+ or Tg4.PD-1−/− Teff cells. (A) Percentage and (B) numbers of CD4+ Tg4 cells within the spleen 4 days after PBS or PIT (12 mice per group), data are pooled from three experiments giving consistent results. (C) Percentage of Ki-67+ cells within the Tg4 CD4+ population (4 mice per group, from one of two experiments giving consistent results).
Figure 5—figure supplement 2. PIT does not increase the frequency of Foxp3+ Tg4 Teff cells.

Figure 5—figure supplement 2.

B10.PLxC57BL/6 mice received PBS/PIT 1 day after transfer of Tg4.PD-1+/+ or Tg4.PD-1−/− Teff cells. (A) Percentage and (B) numbers of Foxp3+CD4+ Tg4 cells within the spleen 4 days after PBS/PIT. Data are pooled from three experiments giving consistent results (12 mice per group).
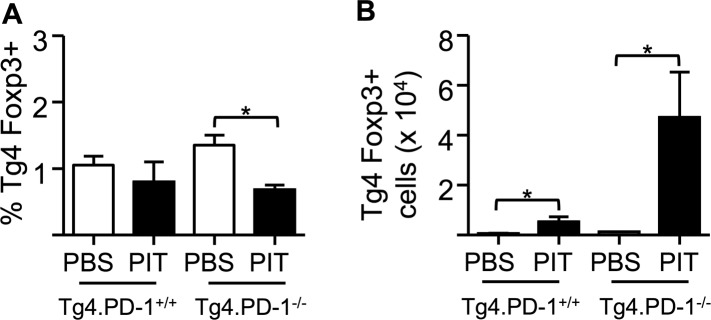
Figure 5—figure supplement 3. PIT limits the frequency of cytokine+ Tg4 Teff cells independently of PD-1.

Figure 5—figure supplement 3.

B10.PLxC57BL/6 mice received PBS/PIT 1 day after transfer of Tg4.PD-1+/+ or Tg4.PD-1−/− Teff cells. Spleens were taken 4 days later for analysis (A) Percentage and (B) numbers of IFN-γ+ and GM-CSF+ CD4+ Tg4 cells following recall stimulation with 20 μM Ac1-9. Data are pooled from three experiments giving consistent results (12 mice per group).
Figure 5—figure supplement 4. PIT-exposed Tg4.PD-1−/− Teff maintain their ability to produce IL-2.

Figure 5—figure supplement 4.

B10.PLxC57BL/6 mice received PBS or PIT 1 day after transfer of Tg4.PD-1+/+ or Tg4.PD-1−/− Teff cells. Spleens were taken for analysis 4 days after PIT for retrieval of CD4+ Tg4 Teff (FACS-sorting). IL-2 production was measured after 48 hr culture with irradiated B10.PLxC57BL/6 splenic APC and MBP peptide, (dotted lines represent IL-2 levels from unstimulated cultures). Data (4 mice per group) are from one of two experiments giving consistent results).
Figure 5—figure supplement 5. PD-1 limits CD25 up-regulation following recall stimulation of PIT-exposed Tg4 Teff.

Figure 5—figure supplement 5.

B10.PLxC57BL/6 mice received PBS/PIT 1 day after transfer of Tg4.PD-1+/+ or Tg4.PD-1−/− Teff cells. Spleens were taken 4 days later for analysis. CD25 expression within the Tg4 CD4+ population (A) directly ex vivo and (B) 12 hr after recall stimulation with 20 μM Ac1-9.
Figure 5—figure supplement 6. PD-1 limits phosphorylation of STAT5 in Tg4 Teff cells following PIT.

Figure 5—figure supplement 6.

B10.PLxC57BL/6 mice received PBS/PIT 1 day after transfer of Tg4.PD-1+/+ or Tg4.PD-1−/− Teff cells. Spleens were taken 4 days later for analysis. Cells were stimulated for 12 hr with 20 μM Ac1-9, to allow upregulation of CD25, before 15-min exposure to IL-2 and detection of pSTAT5. (A) Representative plots of pSTAT5 staining. (B) Percentage of pSTAT5+ cells within the Tg4 CD4+ population. Data (4 mice per group) are from one of two experiments giving consistent results.
Figure 5—figure supplement 7. PIT limits effector cytokine production by polyclonal Teff cells.

Figure 5—figure supplement 7.

(A) CD45.1 mice were immunized with pOVA/CFA and Teff cells generated by restimulation of draining lymph node cells with pOVA + cytokines. Teff cells were transferred into C57BL/6 (CD45.2) host mice prior to administration of pOVA or PBS and splenocytes were retrieved on day 4 (B) Gating strategy for identification of CD45.1+ donor cells within the spleen. (C) Representative plots of intracellular detection of GM-CSF, IFN-γ, TNF-α and IL-17 within the donor CD4+CD45.1+ population following recall stimulation with pOVA. (D) Percentage of cytokine+ cells within the donor Teff population. Data (6 mice per group) are from one of two experiments giving consistent results.
Figure 5—figure supplement 8. PIT drives PD-1 expression in polyclonal Teff cells.

Figure 5—figure supplement 8.

Splenocytes from host mice as described in Figure 5—figure supplement 6 and analysed on day 4. (A) Representative plots of PD-1 staining on CD4+ donor Teff cells after PIT/PBS. (B) Percentage of PD-1+ cells within the donor CD4+ population. (C) MFI of PD-1 staining within the PD-1+ population. Data (six mice per group) are from one of two experiments giving consistent results.