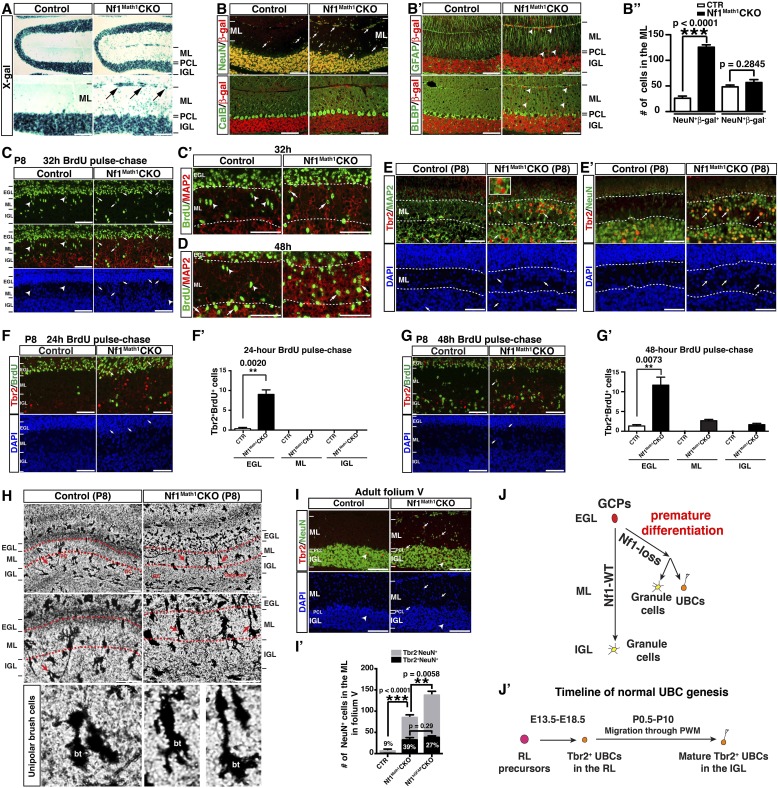
Figure 4. Neuron-specific Nf1 inactivation leads to cell-autonomous defects in the glutamatergic interneuron lineages.
(A) X-gal staining on P21 control and Nf1Math1CKO cerebella labeled cells that underwent Math1-cre-mediated recombination. Arrows point to the abnormally accumulated cells in the ML of the mutant cerebellum. (B, B′) Cerebellar sections were stained for NeuN/β-gal and Cal/β-gal, and GFAP/β-gal and BLBP/β-gal. The total number of NeuN+/β-gal+ and NeuN+/β-gal− cell per high magnification field was quantified in (B′′). (C–D) Control and Nf1Math1CKO mice were analyzed 32 hr and 48 hr after BrdU-pulse at P8. Cerebellar sections were stained for BrdU/MAP2 and imaged at folium V. High magnification images comparing the nuclear morphology of BrdU+ cells are shown in (C′) and (D′). (E, E′) Cerebella sections from P8 control and Nf1Math1CKO mice were stained for Tbr2/MAP2 (E) and Tbr2/NeuN (E′) and imaged at folium V. The inset in (E) shows an example of Tbr2+MAP2+ cells in the mutant ML. (F, G) 24 hr and 48 hr after BrdU-pulse, cerebellar sections from P8 control and Nf1Math1CKO mice were stained for Tbr2/BrdU. The distribution of Tbr2+BrdU+ cells (arrows) in the EGL-ML-IGL was quantified 24 hr and 48 hr after BrdU-pulse in (F′) and (G′), respectively. (H) Golgi staining was performed on P8 cerebellar sections. Cells with UBC morphology are highlighted by red arrows and shown in high magnification (lower panels). Dashed red lines delineate the ML. PC, Purkinje cell; GC, granule cell; bt, the brush tip of UBCs. (I) Cerebellar sections from adult control and Nf1Math1CKO cerebella were stained for Tbr2/NeuN and imaged at folium V. (I′) The number of Tbr2+NeuN+ (arrows) and Tbr2+NeuN− cells (arrowheads) in the ML of folium V per high magnification image was quantified and compared with Nf1hGFAPCKO mice. The percentage of Tbr2+NeuN+ cells among total NeuN+ cells was also quantified. (J) A proposed model summarizes the role of Nf1 in preventing the ectopic differentiation of GCPs into UBCs. As a comparison, the timeline of normal UBC genesis is shown in (J′). All the quantification data are presented as mean ± SEM. DAPI labels the nuclei. Scale bars: 50 μm.


