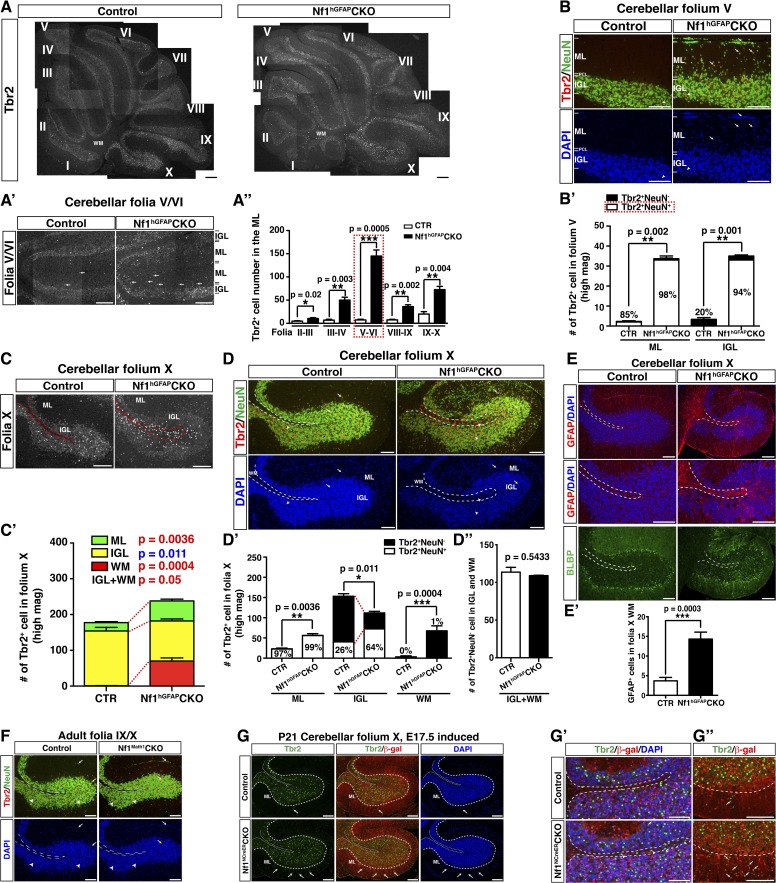
Figure 5. Glia-independent and -dependent UBC abnormalities in the Nf1hGFAPCKO cerebellum.
(A) The overall expression pattern of Tbr2 in the adult control and Nf1hGFAPCKO cerebella was compared. High magnification images were merged to provide a high-resolution view. (A′) Tbr2 staining in folium V/VI was compared. Arrows point to Tbr2+ cells in the ML. The total number of Tbr2+ cell in the ML of each folium was quantified in (A′′). (B) Sections were stained for Tbr2/NeuN and imaged at folium V. The number of Tbr2+NeuN+ cells and Tbr2+NeuN− cells per high magnification field was quantified in (B′). The percentage of Tbr2+NeuN+ cells among Tbr2+ cells is illustrated. (C) Tbr2 staining in folium X was compared. The total number of Tbr2+ cells in the ML, IGL and WM of folia X was quantified in (C′). (D) Sections were stained for Tbr2/NeuN and imaged at folium X. The number of Tbr2+NeuN+ cells and Tbr2+NeuN− cells per high magnification field was quantified in (D′) and (D′′). The percentage of Tbr2+NeuN+ cells is illustrated. (E) Sections were stained for GFAP and BLBP and imaged at folium X. The total number of GFAP+ cells in the WM was quantified in (E′). (F) Cerebellar sections from control and Nf1Math1CKO were stained for Tbr2/NeuN and compared. (G–G′′) Control and Nf1NcreERCKO mice were TM-induced at E17.5 and analyzed at P21. Tbr2/β-gal staining was imaged at folium X (G) and high magnification views of the white matter (G′) and ventral folium X (G′′) were compared. Dashed lines mark the border between the WM and IGL in folium X. Of note, ectopic Tbr2+ cells in the WM of Nf1NcreERCKO were exclusively β-gal-negative (Nf1-wildtype) (G′). In contrast, the increase of Tbr2+ cells in the mutant ML was mostly contributed by Tbr2+β-gal+ cells (Nf1-deficient) (arrows, G′′). Arrows label co-localizing cells and arrowheads label non-co-localizing cells. All the quantification data are presented as mean ± SEM. DAPI labels the nuclei. Scale bars: 50 μm.


