. 2014 Dec 23;3:e05151. doi: 10.7554/eLife.05151

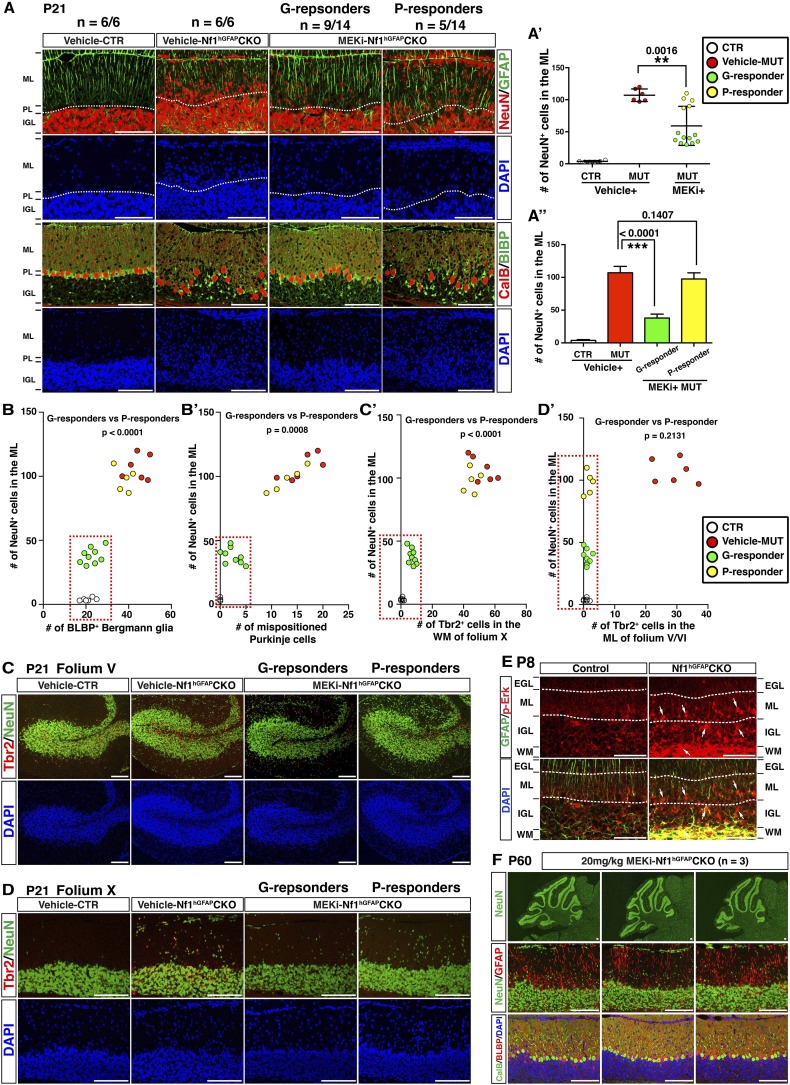
Figure 7. MEKi treatment rescues glia-dependent cerebellar defects in the Nf1hGFAPCKO cerebellum.

(A) Cerebellar sections of vehicle- and MEKi-treated (5 mg/kg) control and Nf1hGFAPCKO mice were stained for GFAP/NeuN and CalB/BLBP and imaged at folium V. 9 out 14 MEKi-treated mutant mice (G-responder) exhibited a significant improvement, although the remaining 5 (P-responder) still had large number of cells in the EGL/ML and displayed severe laminar disruption. The number of NeuN+ cells in the ML was quantified and compared in (A′). For MEKi-treated mutants, green and yellow color represents G-responders and P-responders, respectively. G-responders and P-responders were separated into two groups and compared in (A′′). (C, D) Cerebellar sections were stained for Tbr2/NeuN and imaged at folia V and X. (B, B′, C′, D′) The correlation between the number of NeuN+ cells in the ML, and the number of BLBP+ BG cells (B), mispositioned Purkinje cells (B′), ectopic Tbr2+ cells in the WM (C′) and ML (D′) was plotted and compared. (E) Sections of P8 control and Nf1hGFAPCKO cerebella were stained for GFAP and p-Erk. Arrows highlight the GFAP+p-Erk+ cells in the ML, IGL and WM of the Nf1hGFAPCKO cerebellum. (F) Three Nf1hGFAPCKO mice treated with MEK inhibitor at 20 mg/kg from P0.5–P21 were analyzed at P60. GFAP/NeuN and CalB/BLBP staining show consistent rescue of both neuronal and glial defects. Individual data points are presented, as well as mean ± SEM for each group. DAPI labels the nuclei. Scale bars: 50 μm.

DOI: http://dx.doi.org/10.7554/eLife.05151.017

Figure 7.

Figure 7—figure supplement 1. Ras/Erk signaling is differentially activated in neuronal and glial precursors of the developing Nf1hGFAPCKO cerebellum.

Figure 7—figure supplement 1.

(A, B) Sections of P8 control and Nf1hGFAPCKO cerebella were stained for GFAP and p-Erk. Arrows highlight the GFAP+p-Erk+ cells in the ML, IGL and WM of the Nf1hGFAPCKO cerebellum. (B) is the high magnification view of (A). The different p-Erk level in the neuronal vs glial precursors Nf1hGFAPCKO cerebella is more evident in the images with lower exposure in (B). Boxed images are also shown in Figure 7E. DAPI labels the nuclei. Scale bars: 50 μm.
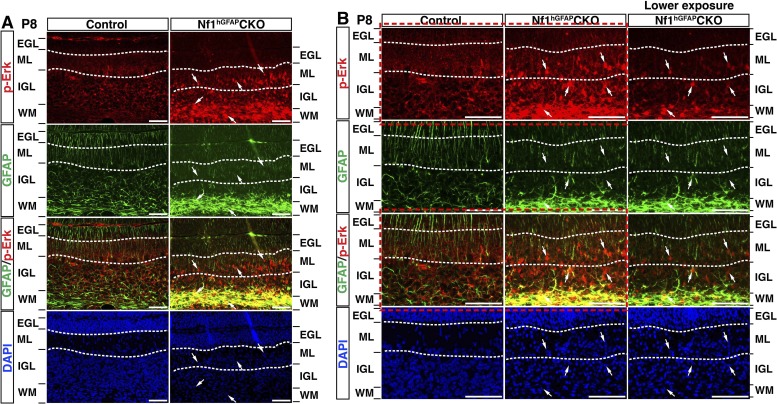
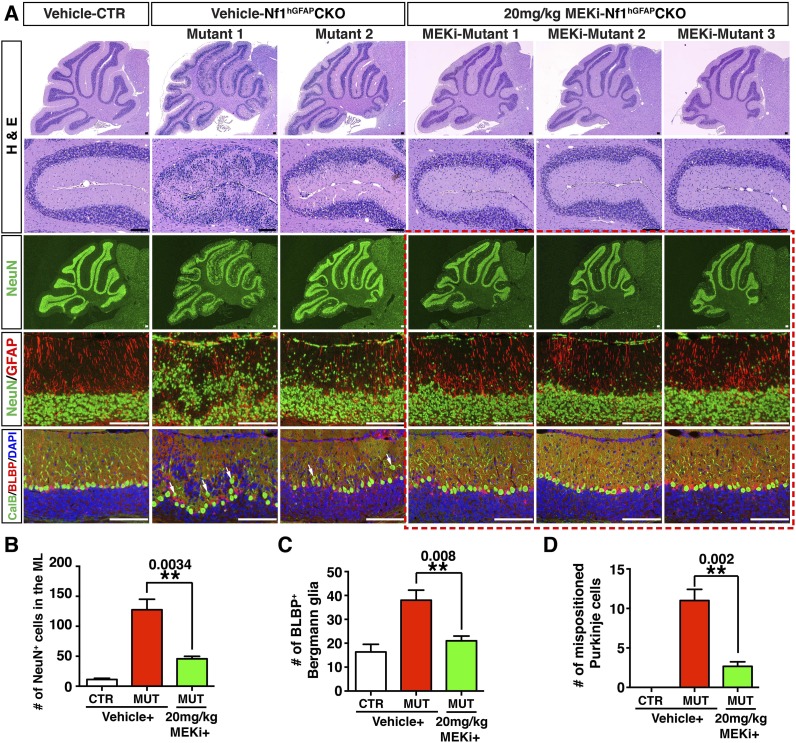
Figure 7—figure supplement 2. High-dose MEKi-treatment produces more consistent phenotypic rescue.

Figure 7—figure supplement 2.

(A) Control and Nf1hGFAPCKO mice were treated with vehicle or MEKi (20 mg/kg) from P0.5–P21 and analyzed at P60. H&E staining of the overall cerebellar structure and folium V are presented. Low magnification view of NeuN staining, as well as high magnification merged images of NeuN/GFAP, CalB/BLBP/DAPI are compared. Arrows point to misaligned Purkinje cells in the ML or IGL. Boxed images are also shown in Figure 7F. The number of NeuN+ cells in the ML, the total number of BLBP+ cells and the number of mispositioned Purkinje cells are quantified in (B), (C) and (D), respectively. DAPI labels the nuclei. All the quantification data are presented as mean ± SEM. Scale bars: 50 μm.