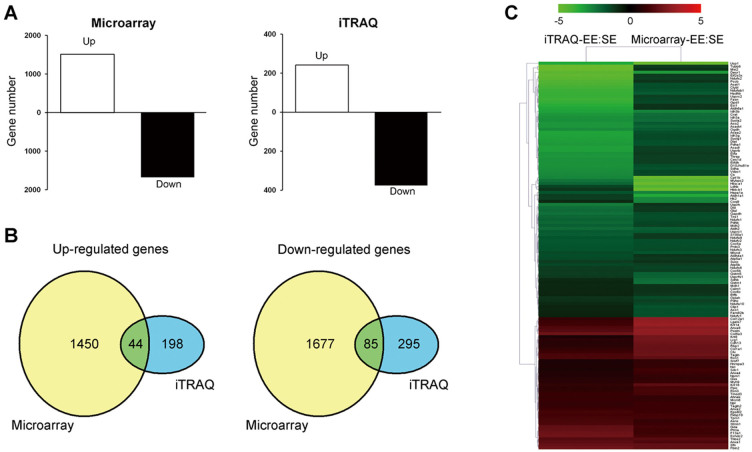
Figure 4. Integrative analyses of differentially expressed genes/proteins in Panc02 tumor caused by enriched environment exposure.
The pooled RNA and protein samples from the Panc02 tumors of the standard environment (SE)- or the enriched environment (EE)-housed mice were subjected to microarrays and isobaric tags for relative and absolute quantification (iTRAQ) assays, respectively. (A) Numbers of mRNAs (left) and proteins (right) differentially expressed in microarray (fold change > 2.0 or < 0.5) and iTRAQ (fold change > 1.5 or < 0.67) assays in the comparison of EE versus SE. (B) Venn diagrams of the numbers of up-regulated (left) and down-regulated (right) mRNAs and proteins identified by the microarray and iTRAQ assays. A total of 44 genes were up-regulated, and 85 were down-regulated at both the mRNA and protein levels. (C) Hierarchical clustering of the 129 genes, for which both the mRNA and protein expression levels changed in the same directions. The fold changes for all genes were log2 transformed prior to performing the clustering analysis. The colored images are presented as described; the green and red colors indicate decreased and increased levels of expression, respectively.

