
Figure 5. Validations of dysregulated genes by quantitative real-time PCR analysis.
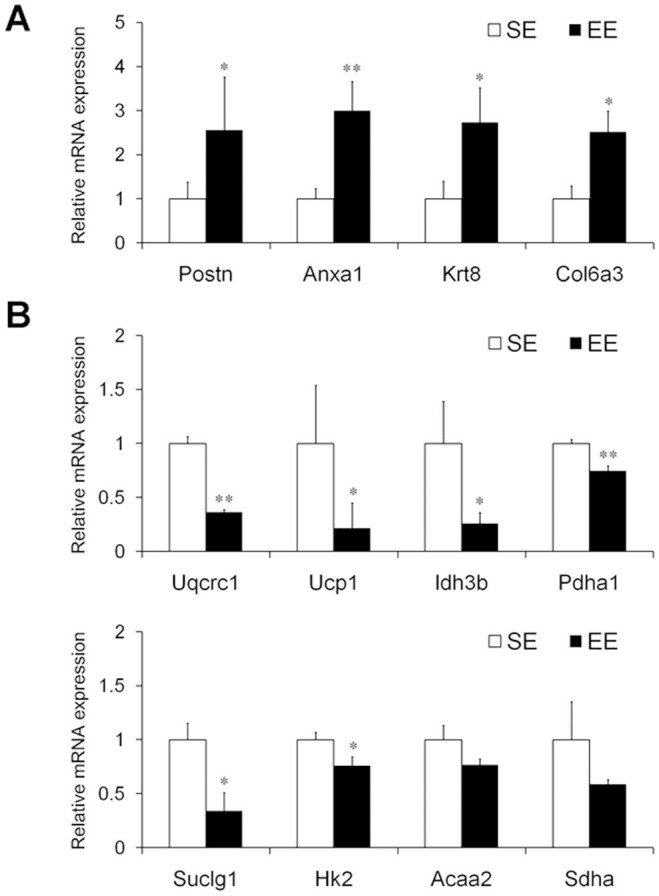
mRNA expression of 4 up-regulated genes (A; Postn, Anxa1, Krt8, and Col6a3) and 8 down-regulated genes (B; Uqcrc1, Ucp1, Idh3b, Pdha1, Suclg1, Hk2, Acaa2, and Sdha) in the Panc02 tumors of the standard environment (SE)- or the enriched environment (EE)-housed mice. All selected genes were confirmed to be changed in the same direction as that identified by the microarray analysis. Four out of the 4 genes were significantly up-regulated (A), and 6 out of the 8 genes were significantly down-regulated (B) following exposure to EE. Data are expressed as relative target gene expression levels compared with β-actin expression and presented as the mean ± SEM (n = 12 per group). * P < 0.05, ** P < 0.01 versus SE mice.