
Figure 2. Illustration of the FHN dynamics.
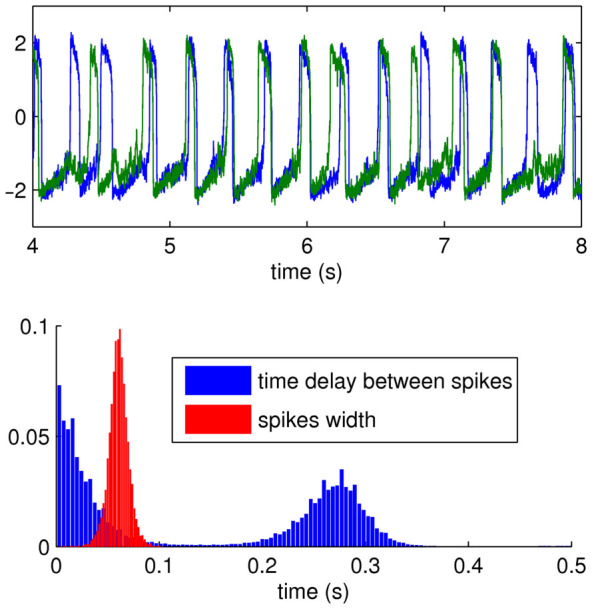
(Top) Example of two time series. (Bottom) Estimated width of spikes and time delays between spikes.
Official websites use .gov
A
.gov website belongs to an official
government organization in the United States.
Secure .gov websites use HTTPS
A lock (
) or https:// means you've safely
connected to the .gov website. Share sensitive
information only on official, secure websites.
(Top) Example of two time series. (Bottom) Estimated width of spikes and time delays between spikes.