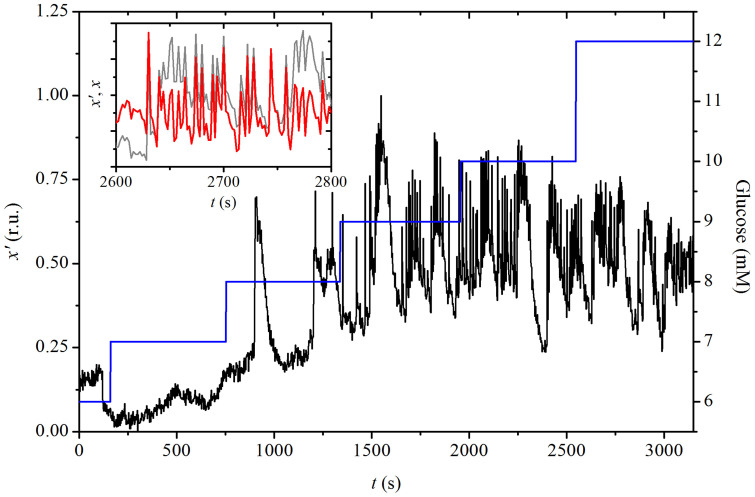
Figure 1. Experimentally measured temporal evolution of [Ca2+]i in a typical beta cell x′(t) in response to different concentrations of glucose expressed in relative units (r.u., black line).
The blue line denotes stepwise increases in glucose concentration with the respective axis located on the right. In the inset, a segment of the original signal (grey line) and the corresponding EEMD x(t) (red line) are shown.

