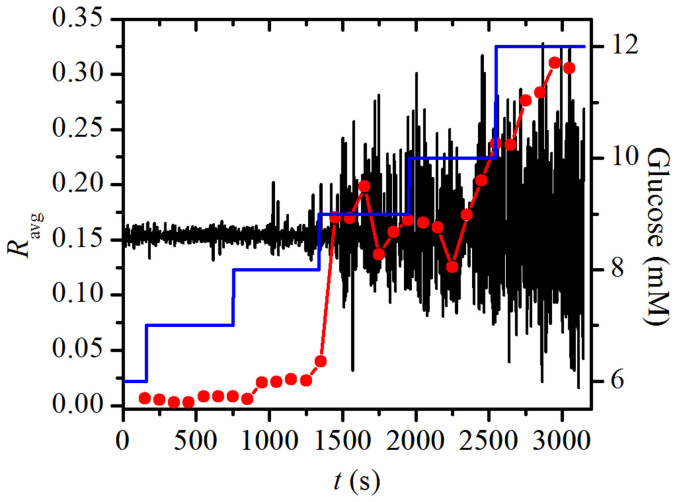
Figure 2. The temporal evolution of the average correlation coefficient (red line with symbols) and the mean-field signal of EEMD processed [Ca2+]i activity of beta cells (black line).
The blue line denotes the concentration of glucose. In the calculation of the sliding window correlation analysis (see Methods), Δτ was set to 300 s and step Δn to 100 s.

