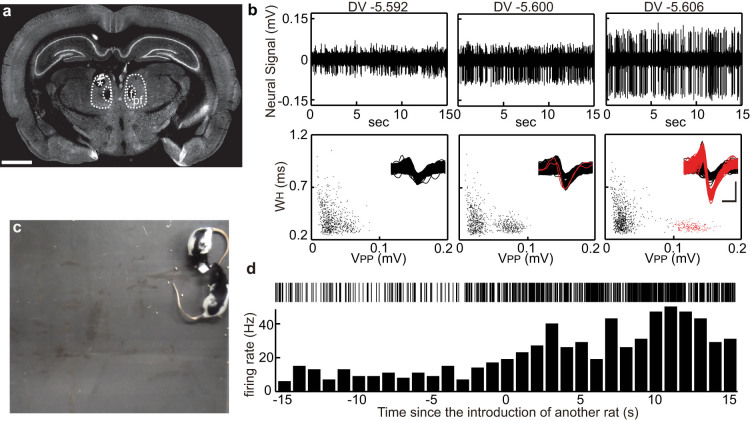
Figure 4. Wireless isolation and recording of single unit activity in the parafascicular nucleus from a freely behaving rat.
(a) A coronal section confirming the recording site (asterisk) in the parafascicular nucleus (PF). The sample was counter-immunostained with anti-NeuN antibody. Scale bar indicates 2 mm. f, fasciculus retroflexus. (b) Neural data recorded by the same electrode in the PF at a depth of 5.592 mm, 5.600 mm, and 5.606 mm are presented. For the scatter plot of spike width (WH) and spike peak amplitude (VPP), all deflections with a negative peak below -20 µV from the same data presented above were used. Overlaid waveforms of all the detected deflections including background noise are shown in the insets. Vertical and horizontal scale bars indicate 100 µV and 0.5 ms, respectively. Black and red indicate deflections with a VPP value < 0.1 mV and ≥ 0.1 mV, respectively. (c) Another rat was introduced to the field. (d) Activity of a putative PF neuron in response to the introduction of another rat.

