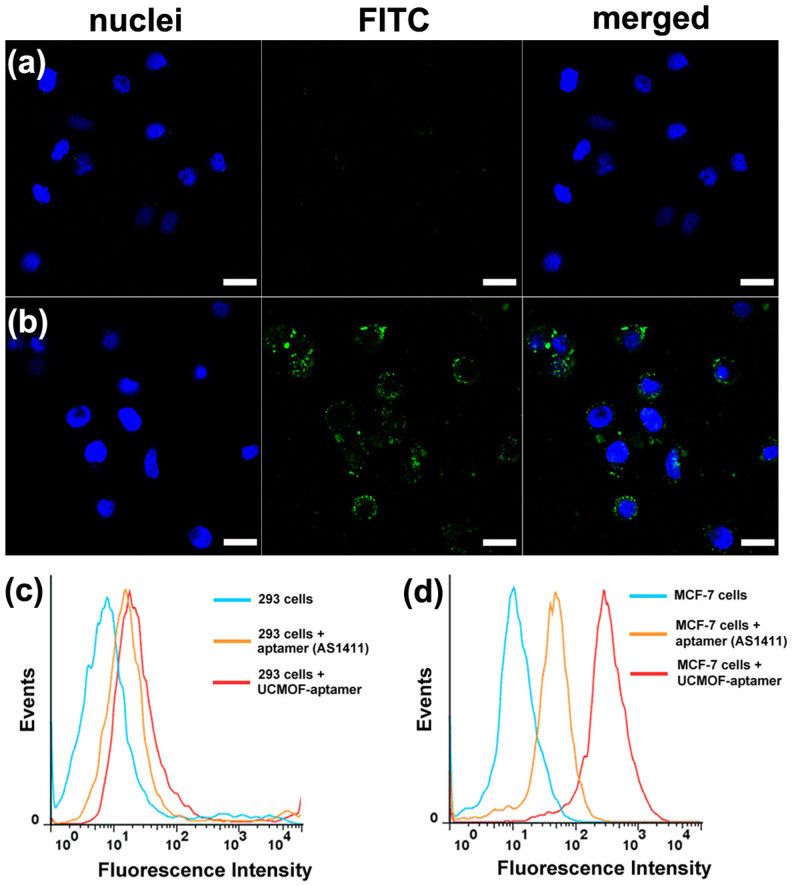
Figure 4. CLSM and flow cytometry analysis.
The confocal laser scanning microscopy (CLSM) images of 293 cells (a) and MCF-7 cells (b) incubated with UCNPs@MOF-DOX-AS1411 NCs for 1 h at 37°C. Each series can be sorted by the nuclei of cells being dyed in blue by Hoechst 33324, FITC labeled UCNPs@MOF-DOX-AS1411 NCs and a merge of the two channels of both above, respectively. All scale bars are 20 μm. Flow cytometry analysis to monitor the binding of aptamer (AS1411-FITC) and UCNPs@MOF-DOX-AS1411 NCs with 293 cells (c; control cells) and MCF-7 cells (d; target cells) for 20 min, respectively.

