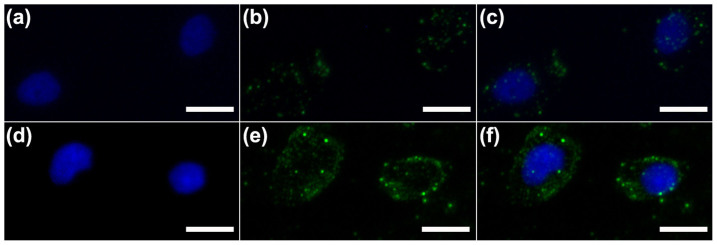
Figure 5. UC Luminescent Imaging.

Inverted florescence microscope images of 293 cells (a–c) and MCF-7 cells (d–f) incubated with UCNPs@MOF-DOX-AS1411. Each series can be classified to the nuclei of cells being dyed in blue by Hoechst 33324 (a, d), up-conversion luminescent images (b, e) and overlay of above (c, f). All scale bars are 20 μm.
